Troubleshoot an error
Using metrics, logs, traces, and profiles together creates a clear investigation path. Metrics show when the error rate increased and which services are affected. Logs reveal the actual error messages. Traces show the full request path and which endpoints are failing. Profiles identify the exact code causing the problem. These signals share the same time ranges and labels. You can pivot between them without manually aligning timestamps. This turns investigation from scattered tool-hopping into a guided workflow.
This workflow shows how to investigate an error using metrics, logs, and traces together.
You can try this workflow on play.grafana.org or on your own Grafana Cloud instance. Refer to Before you begin for more information.
What you’ll achieve
After completing this workflow, you’ll be able to:
- Use metrics to understand error scope and timing
- Find specific error messages in logs
- Trace failing requests to understand the request flow
- Identify root causes by correlating findings across signals
Scenario: Database connection errors
This scenario continues the investigation from Respond to an alert.
You’ve triaged the “High Error Rate - API Server” alert and confirmed the /users endpoint is throwing errors. The error rate jumped from 0.2% to 6.3% at 8:45 PM. Now you need to find the root cause.
Example: Investigate errors
Here’s the investigation flow using different signals:
- Metrics confirm errors started at 8:45 PM, concentrated on the
/usersendpoint - Logs reveal “database connection timeout” and “connection pool exhausted” messages
- Traces show requests to
/userscalling theuser-dbservice, which is timing out after 30 seconds - Profiles show the database connection pool is saturated
This investigation reveals that the database connection pool is exhausted because slow queries aren’t releasing connections fast enough. The immediate fix is to restart the service to clear the pool, but the underlying cause requires investigating the slow queries.
To investigate the scenario, you can use the Grafana Drilldown apps. For detailed guidance on using Drilldown apps, refer to Simplified exploration.
Check error metrics
- Navigate to Drilldown > Metrics.
- Search for error-related metrics, for example,
http_requestsorerrors. - Filter by your service label and look for 5xx status codes.
- Note when errors started and which endpoints are affected.
Find error logs
- Navigate to Drilldown > Logs.
- Filter by your service name.
- Look for error-level messages or search for “error” in the log content.
- Expand log lines to see full error messages and stack traces.
- Look for trace IDs in the logs. You use these to find traces.
Trace failing requests
- If you find a trace ID in logs, click it to jump directly to the trace.
- Or navigate to Drilldown > Traces, filter by service, and set status to error.
- Select an error trace and examine:
- Which span failed (marked in red)
- Error messages in span attributes
- The request path that led to the error
Check downstream services
When errors point to a downstream service, investigate it:
- Check its metrics for availability issues.
- Check its logs for error messages.
- If resource issues appear (high memory, CPU), use Drilldown > Profiles to see what code is consuming resources.
Analyze your findings
This table summarizes the findings for the example scenario.
The root cause is that the database connection pool is exhausted because slow queries aren’t releasing connections.
Try the workflow
Want to try the workflow yourself? Use the public demo environment on play.grafana.org or Grafana Assistant in your own Grafana Cloud instance.
Quick investigation with Grafana Assistant
If you have Grafana Cloud with Grafana Assistant, you can investigate errors quickly with natural language:
Click the sparkle icon in the top navigation bar to open Grafana Assistant.
Ask about the error:
“Show error logs for
api_server”“What traces have errors in the last hour?”
“Which services have the highest error rate?”
Assistant queries the right data sources and helps you correlate findings across signals.
Practice on play.grafana.org
Use the public demo environment to practice error investigation with Drilldown apps.
Note
Data in play.grafana.org fluctuates based on demo environment activity. The demo uses services like
frontendandnginx-jsonrather than theapi_serverscenario.
- Open play.grafana.org and navigate to Drilldown > Metrics.
Search for error-related metrics like
http_requestsor filter for 5xx status codes.Note when errors started and which services are affected.
Navigate to Drilldown > Logs.
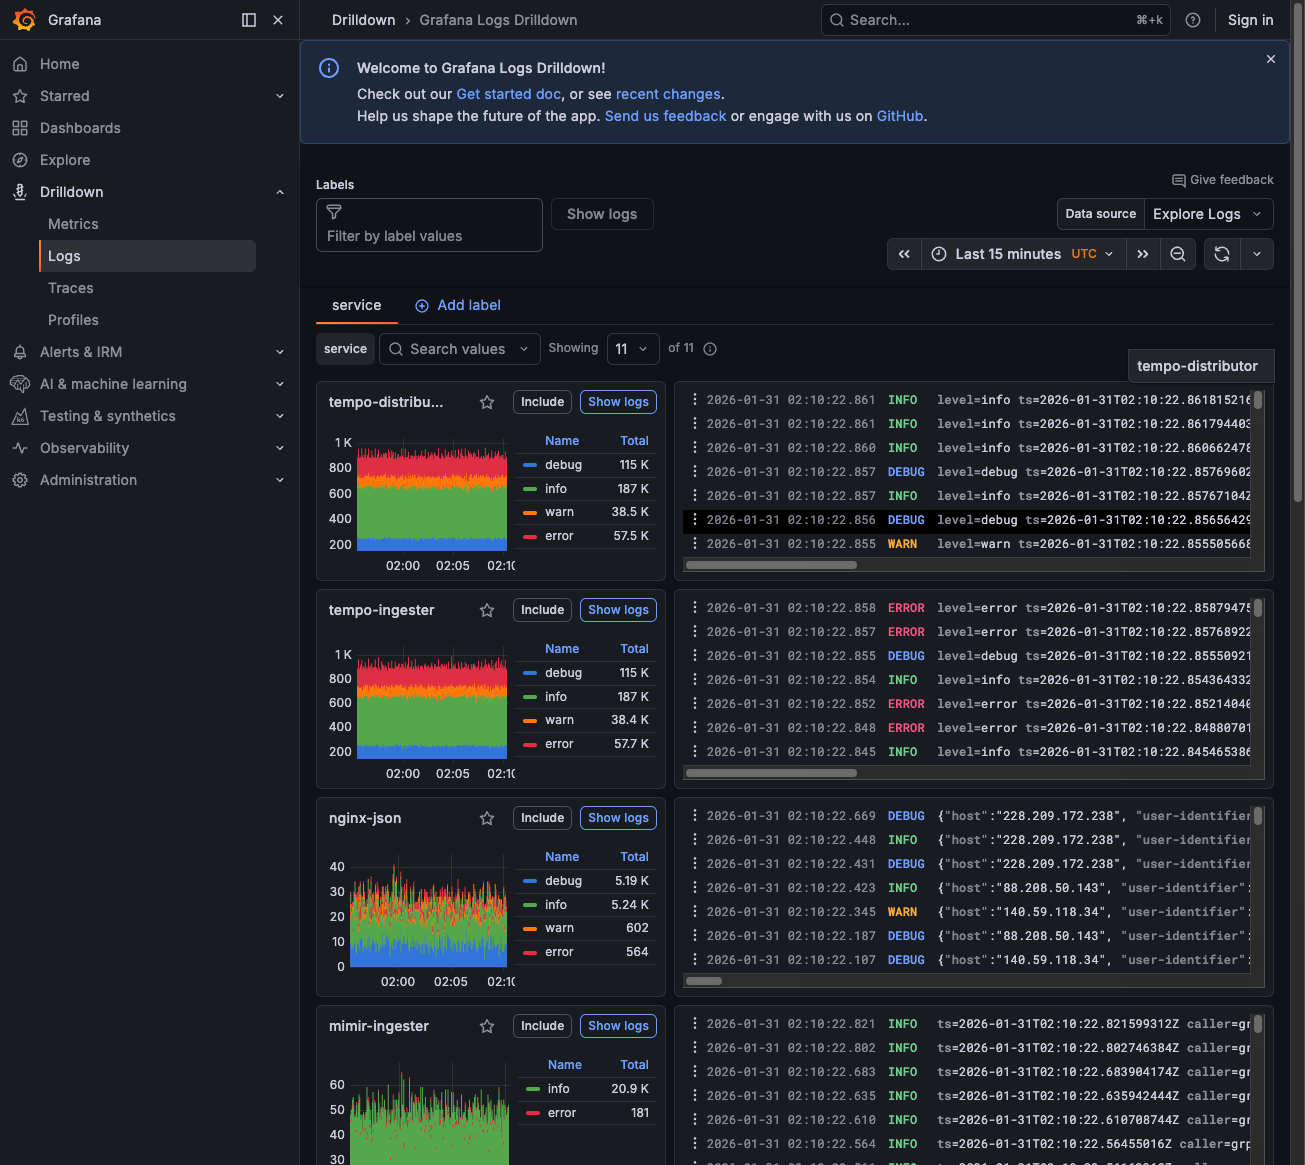
Look at the service breakdown—services like
nginx-jsonshow error counts (you may see 500+ errors).![Logs Drilldown showing services with error counts]()
Click on a service with errors to filter the logs.
Look for error-level messages and expand log lines to see details.
Navigate to Drilldown > Traces and select the Errors rate panel to see error patterns.
Click the Traces tab to see individual error traces and examine the failing spans.
Tips
- Don’t query all logs first: Start with metrics to narrow scope.
- Don’t assume trace sampling is broken: Sampling is designed to drop some traces.
- Don’t ignore label standardization: Mismatched labels break correlation.
- Don’t use logs for counters: Metrics are cheaper and faster.
Label mapping reference
Next steps
- Respond to an alert - Triage alerts and route to the right workflow
- Investigate slow performance - Investigate latency issues
- Find slow code from a trace - Navigate from traces to profiles


