Investigate slow performance
When users report slowness, you need to pinpoint exactly where time is being spent. Metrics quantify the problem—which endpoints are slow, by how much, and since when. Traces show the request path and reveal which service or span is the bottleneck. Profiles identify the exact functions consuming CPU or memory. By correlating these signals, you can move from “the app is slow” to “this specific database query is taking 600ms instead of 50ms” without guessing.
This workflow shows how to investigate latency issues using metrics, traces, and profiles together.
You can try this workflow on play.grafana.org or on your own Grafana Cloud instance. Refer to Before you begin for more information.
What you’ll achieve
After completing this workflow, you’ll be able to:
- Quantify latency issues using metrics
- Find slow requests using traces
- Compare slow and fast traces to identify differences
- Profile code to find bottlenecks
Scenario: Slow database queries
This scenario continues the investigation from Troubleshoot an error.
After restarting api_server to clear the exhausted connection pool, the service recovers but users still report slowness. Metrics show p99 latency for the /users endpoint is 800ms—normal is 150ms. The latency increase started at 8:30 PM, 15 minutes before the errors began.
Example: Investigate latency
Here’s the investigation flow using different signals:
- Metrics show p99 latency for
/userswent from 150ms to 800ms at 8:30 PM - Traces reveal the
user-dbspan is taking 600ms instead of the normal 50ms - Trace comparison shows slow traces execute
SELECT * FROM users WHERE email LIKE '%...'(full scan), while fast traces use indexed lookups - Profiles identify the
UserRepository.findByEmail()function as the bottleneck
This investigation reveals that a recent code change introduced a full table scan query pattern. The underlying fix requires optimizing the query or adding an index. Refer to Find slow code from a trace for more information.
To investigate the scenario, you can use the Grafana Drilldown apps. For detailed guidance on using Drilldown apps, refer to Simplified exploration.
Check latency metrics
- Navigate to Drilldown > Metrics.
- Search for latency metrics, for example,
http_request_durationorlatency. - Filter by service and look at p99 or p95 percentiles.
- Note when latency increased and which endpoints are affected.
Find slow traces
- Navigate to Drilldown > Traces.
- Look at the duration histogram on the right—traces with higher durations appear on the right side.
- Click on slow traces (high duration values) to examine them.
- In the trace view, look at the span timeline to see where time is spent.
Identify the bottleneck
In the trace timeline:
- Look for the widest spans—these consume the most time.
- Check if slowness is in your service or a downstream call.
- Note the span name and service for further investigation.
Compare slow and fast traces
- In Drilldown > Traces, click on a fast trace (low duration).
- Open both traces in separate tabs and compare:
- Are the same services called?
- Which spans are different?
- Are there different attributes, for example, query type, user, or region?
Check resource metrics
- Navigate to Drilldown > Metrics.
- Search for resource metrics (CPU, memory) for the slow service.
- Look for spikes or saturation that correlate with the latency.
Profile the code (if available)
If the slow span is in your application code (not an external call):
- Navigate to Drilldown > Profiles.
- Select CPU profile for the service.
- Set the time range to when slowness occurred.
- Look for wide bars in the flame graph—these are hot functions.
Try the workflow
Want to try the workflow yourself? Use the public demo environment on play.grafana.org or Grafana Assistant in your own Grafana Cloud instance.
Quick investigation with Grafana Assistant
If you have Grafana Cloud with Grafana Assistant, you can investigate latency quickly with natural language:
Click the sparkle icon in the top navigation bar to open Grafana Assistant.
Ask about latency:
“Show p99 latency for
api_server”“Which endpoints have the highest latency?”
“Find slow traces for
checkoutservice”
Assistant queries the right data sources and helps you identify bottleneck spans.
Practice on play.grafana.org
Use the public demo environment to practice latency investigation with Drilldown apps.
Note
Data in play.grafana.org fluctuates based on demo environment activity. The demo uses services like
frontendandcheckoutservicerather than theapi_serverscenario.
- Open play.grafana.org and navigate to Drilldown > Metrics.
Search for latency-related metrics and note which services show elevated p99 values.
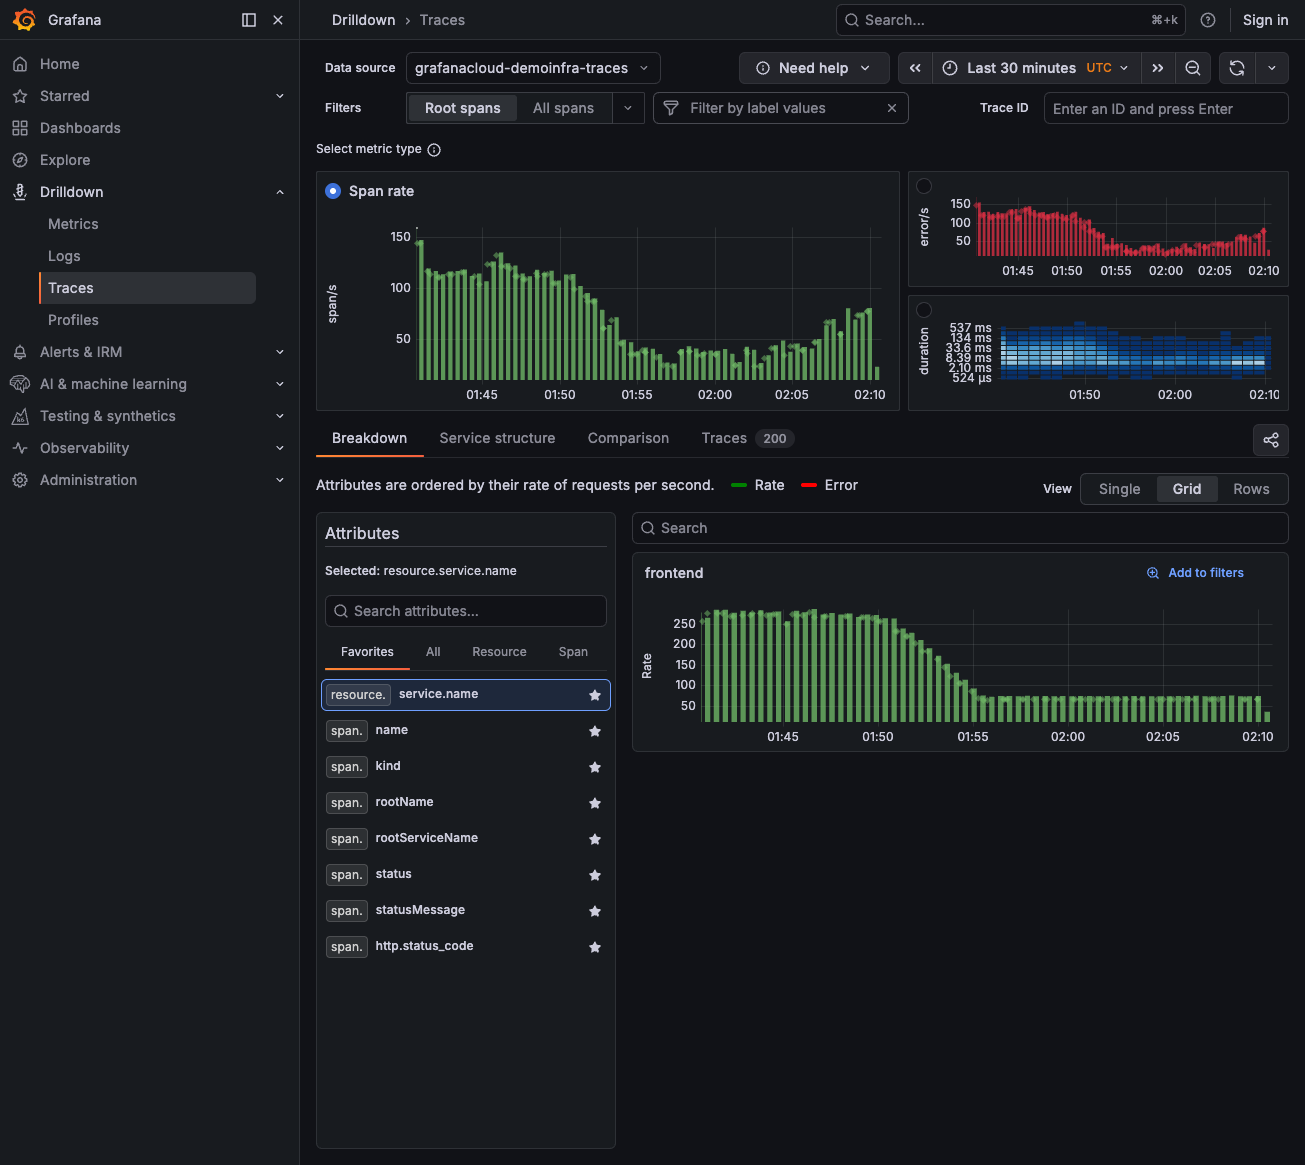
Navigate to Drilldown > Traces.
Look at the duration histogram (blue panel on the right)—traces on the right side have higher latency.
![Traces Drilldown showing span rate, error rate, and duration histogram]()
Click on a slow trace (high duration) to open the trace view.
Examine the span timeline to see which span took the most time.
Compare with a fast trace to identify what’s different.
Navigate to Drilldown > Profiles to see if CPU profiling data is available for the slow service.
Analyze your findings
Combine findings from all signals:
Root cause: A recent code change introduced a query pattern that triggers full table scans instead of using the email index.
Tips
- Start with metrics. Quantify the problem first to understand scope.
- Check downstream services. Investigate dependencies before assuming the issue is in your code.
- Use traces before profiles. Identify what to profile from traces.
Next steps
- Respond to an alert - Triage alerts and route to the right workflow
- Troubleshoot an error - Investigate errors using metrics, logs, and traces
- Find slow code from a trace - Navigate from traces to profiles


