Find slow code from a trace
Traces tell you which service is slow; profiles tell you exactly which function is responsible. When a trace shows a span taking 600ms, you can navigate to the CPU profile for that service and time range to find the hot code path. The flame graph visualization makes bottlenecks obvious—wide bars represent functions consuming significant time. This correlation turns vague performance complaints into actionable code fixes.
This workflow shows how to navigate from a slow trace span to the exact code causing the bottleneck using profiles.
You can try this workflow on play.grafana.org or on your own Grafana Cloud instance. Refer to Before you begin for more information.
What you’ll achieve
After completing this workflow, you’ll be able to:
- Navigate from a slow trace span to the corresponding profile
- Analyze flame graphs to identify bottleneck functions
- Correlate profile findings with other signals
Scenario: N+1 query pattern in database code
This scenario continues the investigation from Investigate slow performance.
You’ve identified that the user-db service span is taking 600ms instead of the normal 50ms. Traces show the query is a full table scan, but you need to find the exact code responsible. CPU profiling reveals where the time is spent.
Example: Navigate from traces to profiles
Here’s the investigation flow using different signals:
- Traces show the
user-dbspan taking 600ms, called fromapi_server - Profiles for
user-dbaround 8:40 PM show 65% of CPU time inUserRepository.findByEmail() - Flame graph reveals the function loads users, then loops to load each user’s preferences individually (N+1 pattern)
- Root cause: Each request triggers 50+ database queries due to missing eager loading
The fix is to add eager loading for user preferences or batch the preference queries.
To investigate the scenario, you can use the Grafana Drilldown apps. For detailed guidance on using Drilldown apps, refer to Simplified exploration.
Find the slow span
- Navigate to Drilldown > Traces.
- Look at the duration histogram to see latency distribution.
- Click on a slow trace (high duration).
- In the trace view, expand the span waterfall to find the slow span.
- Note the service name, span name, and timestamp.
Navigate to profiles
If span profiles are configured:
- In the trace view, look for a Profiles link on the slow span.
- Click to jump directly to the profile for that span.
If span profiles aren’t configured:
- Navigate to Drilldown > Profiles.
- Select the same service name as the slow span.
- Set the time range to match when the slow trace occurred.
- Select the appropriate profile type:
- CPU for busy loops or high CPU usage
- Memory for allocation issues or GC pauses
- Goroutine for concurrency issues
- Mutex for lock contention
Analyze the flame graph
In the profile view:
- Look for wide bars—these are functions consuming significant time.
- Hover over bars to see function names and percentages.
- Click to drill down into the call stack.
Common patterns:
Compare with baseline
- Change the time range to before the issue occurred.
- Compare flame graphs to identify what changed.
- Look for new wide bars or functions that grew.
Profile type selection guide
If you’re unsure, start with CPU, then compare with Memory/alloc to see allocation impact.
Try the workflow
Want to try the workflow yourself? Use the public demo environment on play.grafana.org or Grafana Assistant in your own Grafana Cloud instance.
Quick investigation with Grafana Assistant
If you have Grafana Cloud with Grafana Assistant, you can navigate from traces to profiles with natural language:
Click the sparkle icon in the top navigation bar to open Grafana Assistant.
Ask about profiles:
“Show CPU profiles for user-db”
“What functions are using the most CPU?”
“Compare profiles from today vs yesterday”
Assistant helps you find the right profile data and interpret flame graphs.
Practice on play.grafana.org
Use the public demo environment to practice navigating from traces to profiles with Drilldown apps.
Note
Data in play.grafana.org fluctuates based on demo environment activity. The demo has 21 services with profile data including
checkoutservice,productcatalogservice, andadservice.
- Open play.grafana.org and navigate to Drilldown > Traces.
Look at the duration histogram and click on a slow trace (high duration).
Note the service name, for example,
checkoutservice, and when the trace occurred.Navigate to Drilldown > Profiles.
Find the same service in the grid view—each service shows CPU usage graphs.
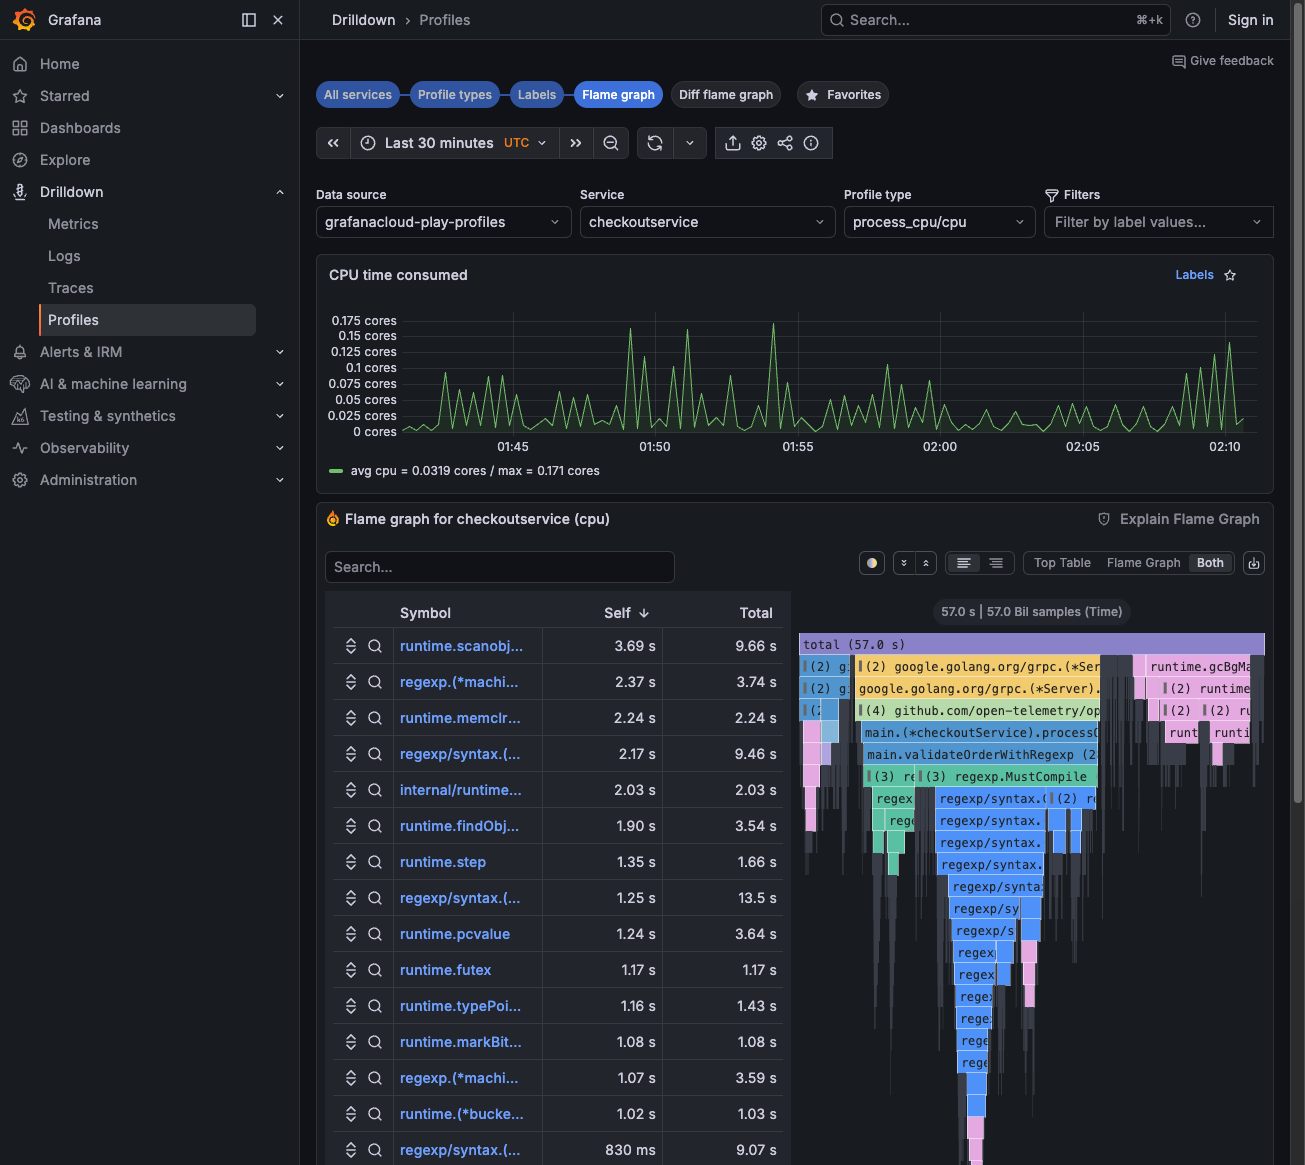
Click Flame graph on a service to see the flame graph visualization.
Look for wide bars—these are functions consuming the most CPU time. The symbol table on the left shows function names and Self/Total times.
![Profiles Drilldown showing flame graph with symbol table]()
Troubleshooting
This section covers common issues and how to troubleshoot them. Each topic includes a brief description of what the situation means, why it happens when known, and steps to resolve it.
Can’t find profiles for the trace
What it means: You can see traces for a slow span, but when you navigate to profiles, either via the Profiles link on a span or by switching to Drilldown > Profiles. No profile data appears for that service or time range.
Why it happens: Trace-to-profile correlation in Grafana Cloud depends on shared labels and alignment between Tempo (traces) and Pyroscope (profiles). Mismatched service names, time ranges, or missing label mappings break this link. Profiles are also collected separately from traces. If your service isn’t instrumented for profiling or profiles aren’t being exported, no data exists.
How to fix it:
- Verify service names match between traces and profiles. Traces use
resource.service.name; profiles use labels likeservice_name. If your stack uses different conventions, ensure the Traces to profiles configuration maps labels correctly, for example,service.nametoservice_name. - Try a broader time range (±5 minutes from the trace). Profile aggregation and sampling can introduce slight timing differences.
- Confirm profiles are being collected for this service. Check that your application is instrumented for profiling and that profile data is reaching Grafana Cloud. Refer to Send profile data.
Flame graph doesn’t show the bottleneck
What it means: The flame graph loads, but it doesn’t reveal the function or code path causing the slowdown you observed in the trace. You may see flattened or uninformative stacks, or the hot path doesn’t match your expectations.
Why it happens: CPU profiles measure where time is spent in CPU-bound code. If the bottleneck is I/O (database, network, disk), the CPU flame graph may show mostly idle or waiting states. Different profile types highlight different aspects: CPU shows computation; memory shows allocations; goroutine shows concurrency; mutex shows lock contention. Choosing the wrong type or an insufficient time range can hide the real culprit.
How to fix it:
- Try different profile types:
- CPU for busy loops and high CPU
- Memory/alloc for OOM or GC pauses
- Goroutine for channel waits
- Mutex for lock contention
- Zoom into specific functions by clicking bars in the flame graph to drill down into the call stack.
- Compare with a baseline from when performance was good. Set the time range to before the issue started and look for new or widened bars in the problematic period.
Configure traces to profiles
To enable the Profiles link in trace views:
- Go to Connections > Data sources > your Tempo data source.
- Scroll to Traces to profiles.
- Enable and select your Pyroscope data source.
- Configure label mappings, for example,
service.nametoservice_name.
For span-level profile links, instrument your application with span profiles. Refer to Span profiles documentation.
Next steps
- Respond to an alert - Triage alerts and route to the right workflow
- Troubleshoot an error - Investigate errors using metrics, logs, and traces
- Investigate slow performance - Full latency investigation workflow


