What are telemetry signals?
Telemetry signals are the data your systems produce to help you understand their behavior. Grafana Cloud collects, stores, and correlates four types of signals: metrics, logs, traces, and profiles.
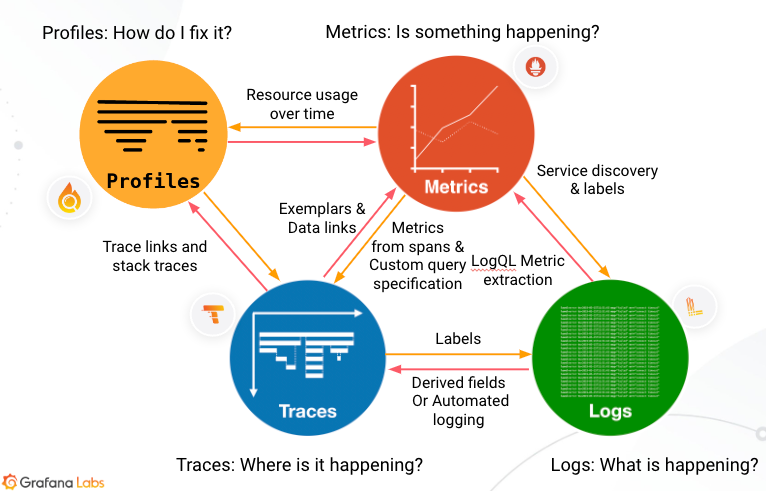
Each signal answers different questions. Together, they give you complete visibility into your applications and infrastructure.
When an alert fires for high API latency, for example, you can jump from the metric to related logs. Follow a trace ID to identify which service is slow, then view a profile to find the exact function causing the bottleneck.
When you correlate signals, you get a complete view of your application and infrastructure.
Why telemetry signals matter
When something goes wrong, you need answers fast. A single signal type rarely tells the whole story:
- Metrics tell you something is wrong
- Logs tell you what happened
- Traces tell you where it happened
- Profiles tell you why the code is slow
By using signals together, you move from alert to root cause in minutes instead of hours.
To learn how signals connect, refer to Observability concepts.
Metrics
Metrics are numeric measurements collected over time that provide a high-level picture of system state. They’re lightweight, highly compressed, and ideal for dashboards and alerting. Metrics form the foundation of alerts because they’re numeric values that you can compare against known thresholds. An alert triggers when a value exceeds an expected range, which is typically the first sign of an issue.
Logs
Logs are timestamped text records of discrete events. They capture detailed context about what happened at a specific moment.
Unlike metrics, which are numeric and structured, logs are textual and unstructured or semi-structured. They provide an audit trail of activity and act as atomic events that detail what’s occurring in your services. Logs offer more detail than metrics, but they create higher data volumes.
Traces
Traces follow a single request as it moves through distributed services. They provide the map, the where, of what’s going wrong.
A trace shows how long each step in the data flow takes to complete, for example, an HTTP request, a database lookup, or a call to a third-party service. Each trace contains spans that represent individual operations. This data helps you locate problem areas and assess their impact.
Profiles
Profiles capture CPU and memory usage at the code level. They show exactly which functions consume resources.
Profiles help you identify specific lines of code or functions to optimize, which improves performance and reduces cost.
Next steps
- How Grafana products use telemetry signals to understand which signals each product uses
- Quick start to explore telemetry signals in Grafana Play
- Observability concepts to understand how signals work together


