
Build data pipelines
You learned about components in the previous section. They’re building blocks that perform tasks such as reading files, collecting metrics, or processing data. Now you’ll learn how to connect components to create pipelines that collect, transform, and send telemetry data.
What are pipelines?
A pipeline forms when components reference each other’s exports. You learned about component exports in the previous section. These are the values that running components make available to other components.
// Simple constant value
log_level = "debug"

// Expression that references a component export
api_key = local.file.secret.content
When you use an expression like local.file.secret.content in a component’s arguments, you create a dependency.
Alloy automatically re-evaluates the dependent component whenever the referenced component updates its exports.
Your first pipeline
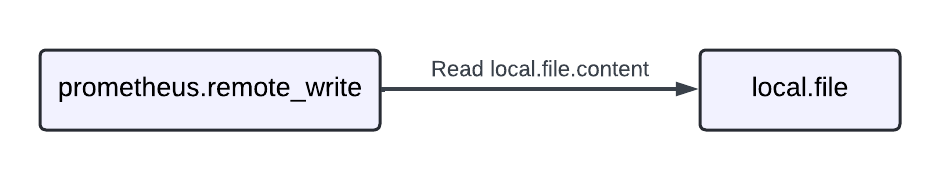
This pipeline reads a password from a file and uses it to authenticate with a remote system:
local.file "api_key" {
    filename = "/etc/secrets/api.key"
}

prometheus.remote_write "production" {
    endpoint {
        url = "http://localhost:9090/api/v1/write"

        basic_auth {
            username = "admin"
            password = local.file.api_key.content
        }
    }
}
This pipeline has two components:
local.filereads a file and exports its content.prometheus.remote_writeuses that content as a password.
The key configuration elements are:
- Component exports:
local.file.api_key.contentexports the file’s content. - Component references: The
passwordattribute references the export from another component. - Automatic updates: When the file changes, Alloy automatically updates the password used by the remote write component.
Multi-stage pipelines
You can chain multiple components together to create more complex pipelines. This example shows a complete metrics collection pipeline:
// Discover Kubernetes pods to scrape
discovery.kubernetes "pods" {
  role = "pod"
}

// Scrape metrics from the discovered pods
prometheus.scrape "app_metrics" {
  targets    = discovery.kubernetes.pods.targets
  forward_to = [prometheus.remote_write.production.receiver]
}

// Send metrics to remote storage
prometheus.remote_write "production" {
  endpoint {
    url = "https://prometheus.example.com/api/v1/write"

    basic_auth {
      username = "metrics"
      password = local.file.api_key.content
    }
  }
}

// Read API key from file
local.file "api_key" {
  filename = "/etc/secrets/api-key"
  is_secret = true
}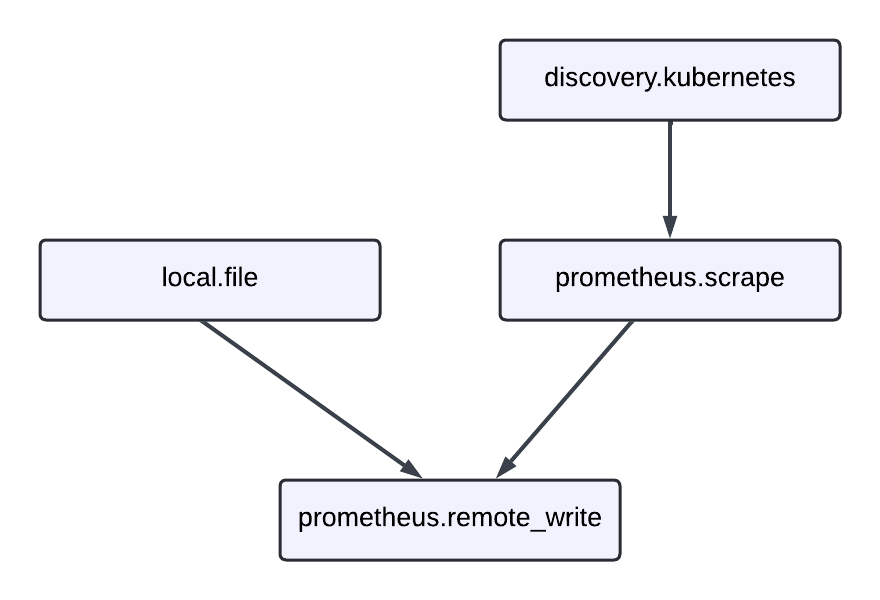
This pipeline demonstrates several key concepts:
- Service discovery:
discovery.kubernetesfinds targets to monitor. - Data collection:
prometheus.scrapecollects metrics from those targets. - Data forwarding: The
forward_toattribute connects components by sending data from one to another. - Authentication: The remote write component uses credentials from a file.
The forward_to attribute is a special configuration element that creates data flow connections between components.
It accepts a list of component receivers that process the data.
Log processing pipeline
Here’s a more complex example that processes log data through multiple transformation stages:
// Read log files using glob patterns
loki.source.file "local_files" {
    targets    = [{__path__ = "/var/log/app/*.log"}]
    forward_to = [loki.process.add_labels.receiver]

    file_match {
        enabled = true
        sync_period = "10s"
    }
}

// Extract data from log messages and add labels
loki.process "add_labels" {
    stage.logfmt {
        mapping = {
            "extracted_level" = "level",
            "extracted_service" = "service",
        }
    }

    stage.labels {
        values = {
            "level" = "extracted_level",
            "service" = "extracted_service",
        }
    }

    forward_to = [loki.write.grafana_cloud.receiver]
}

// Send processed logs to Loki
loki.write "grafana_cloud" {
    endpoint {
        url = "https://logs-prod.grafana.net/loki/api/v1/push"

        basic_auth {
            username = "12345"
            password = local.file.api_key.content
        }
    }
}

// Read API credentials
local.file "api_key" {
    filename = "/etc/secrets/loki-key"
    is_secret = true
}
This pipeline shows how data flows through multiple processing stages:
- Discovery: Find log files to monitor.
- Collection: Read log entries from files.
- Transformation: Parse log messages and extract metadata.
- Enrichment: Add structured labels to log entries.
- Output: Send processed logs to remote storage.
Pipeline patterns
Use these common patterns to build effective data processing workflows.
Fan-out pattern
Send data from one component to multiple destinations.
This uses the forward_to attribute with multiple receivers:
prometheus.scrape "app_metrics" {
  targets = [{"__address__" = "app:8080"}]
  forward_to = [
    prometheus.remote_write.production.receiver,
    prometheus.remote_write.staging.receiver,
  ]
}

prometheus.remote_write "production" {
  endpoint {
    url = "https://prod-prometheus.example.com/api/v1/write"
  }
}

prometheus.remote_write "staging" {
  endpoint {
    url = "https://staging-prometheus.example.com/api/v1/write"
  }
}
This pattern is useful for:
- Testing changes in staging before production.
- Sending different datasets to different systems.
- Creating redundant data storage for reliability.
Chain processing pattern
Transform data through multiple stages:
loki.source.file "raw_logs" {
  targets = [{"__path__" = "/var/log/app.log"}]
  forward_to = [loki.process.parse.receiver]
}

loki.process "parse" {
  stage.json {
    expressions = {
      level = "level",
      message = "msg",
    }
  }
  forward_to = [loki.process.filter.receiver]
}

loki.process "filter" {
  stage.match {
    selector = "{level=\"error\"}"
    action   = "keep"
  }
  forward_to = [loki.write.alerts.receiver]
}

loki.write "alerts" {
  endpoint {
    url = "https://loki.example.com/loki/api/v1/push"
  }
}
This pattern demonstrates progressive data refinement:
- Parse: Extract structured data from raw logs.
- Filter: Keep only relevant log entries (error level).
- Output: Send filtered logs to alerting system.
Best practices
Follow these guidelines to build maintainable and efficient pipelines.
Keep pipelines focused
Break complex pipelines into logical stages. Each component should have a clear, single responsibility.
Use descriptive labels
Choose component labels that describe their purpose:
// Good: Descriptive labels
prometheus.scrape "api_metrics" { }
prometheus.scrape "database_metrics" { }

// Avoid: Generic labels
prometheus.scrape "scraper1" { }
prometheus.scrape "scraper2" { }
Handle secrets securely
Mark sensitive components appropriately:
local.file "database_password" {
  filename = "/etc/secrets/db-password"
  is_secret = true  // Prevents value from appearing in UI
}
Test incrementally
Build pipelines step by step. Start with basic data collection, then add processing and forwarding components.
Debug pipelines
When pipelines don’t work as expected:
- Check component health in the Alloy UI. Unhealthy components appear in red.
- Verify component exports contain expected data. Use the UI to inspect export values.
- Review component dependencies to ensure proper data flow. Check that
forward_toreferences match receiver exports. - Check for reference cycles - components can’t reference themselves directly or indirectly.
- Validate configuration syntax - ensure you spell component and export names correctly.
The Alloy UI provides detailed information about component state, exports, and health status to help troubleshoot pipeline issues.
Next steps
Now that you understand how to build pipelines, learn more about component management and dynamic configurations:
- Component controller - Learn how Alloy manages component execution
- Expressions - Create dynamic configurations using functions and references
For hands-on learning:
- Tutorials - Follow step-by-step guides to build complete monitoring solutions


