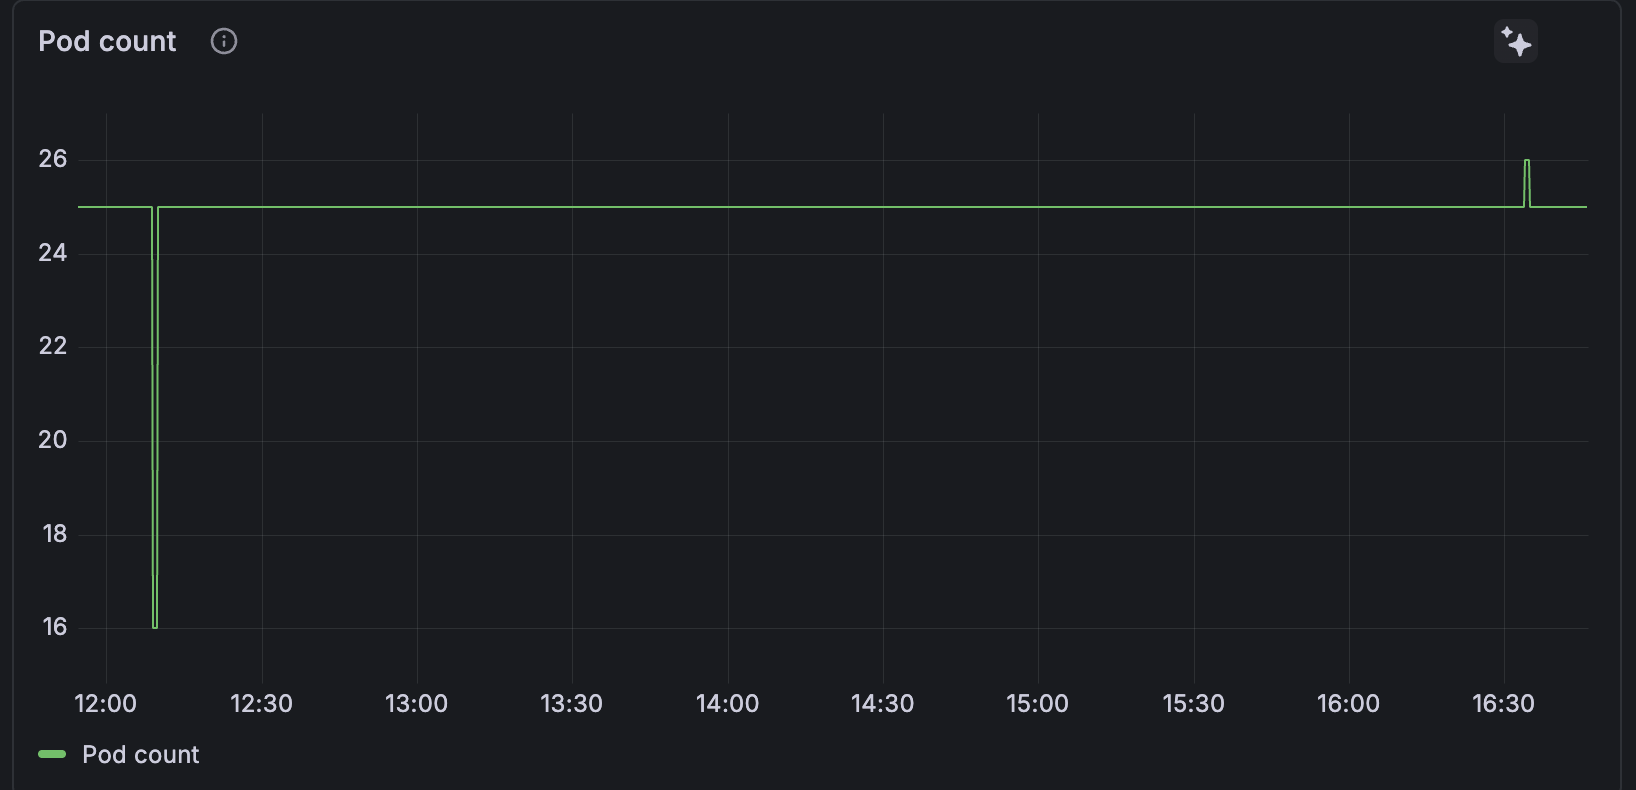
Gain insight with Pod count
The Pod count panel on any workload detail page provides early visibility into workload pressure by linking replica changes to CPU and memory spikes. This helps you see scaling behavior before failures occur.

Pod count can help you:
Confirm scaling behavior
You can immediately see whether a workload is scaling up or down as expected, either manually or through an HPA.Correlate cause and effect. When latency spikes, errors increase, or CPU and memory usage changes, Pod count helps answer key questions:
- Did the workload scale before or after the issue started?
- Did scaling resolve the problem or make it worse?
Detect failed or delayed scaling. If traffic increases but Pod count stays flat, autoscaling may not be working correctly. If Pod count oscillates, it can indicate overly aggressive or misconfigured HPA thresholds.
Understand workload resource pressure. Changes in Pod count explain sudden shifts in workload-level CPU and memory usage, helping users see how scaling activity contributes to resource pressure before performance degrades.
Debug rollout and deployment behavior. During deployments, Pod count reveals rolling update progress, stalled replicas, or unexpected Pod churn that may not be obvious from logs or metrics alone.
Make informed operational decisions. Historical Pod count trends help users decide whether to adjust:
- Min/max replicas
- Autoscaling policies
- Resource requests and limits
Analysis and troubleshooting
Navigate to any Workload detail page and view the Pod count panel. Use the time range selector to increase the time range and view the Pod count.
Pod count is most useful over hours for troubleshooting, days for behavior validation, and weeks for capacity planning. The following are recommended time ranges depending on the type of issue you’re investigating.
| Typical use case | Time range | What it reveals | Time range disadvantages |
|---|---|---|---|
| - Actively debugging an incident - Watching a rollout or manual scale - Verifying an HPA response in near-real time | Last 30 min - 2 hours | Exact moments when Pod count changes, including rapid scale-up/scale-down and unstable scaling behavior | - Misses broader patterns - Easy to misinterpret one-off events |
| - General troubleshooting - Investigating recent performance or reliability issues - Correlating scaling with errors, latency, or load | Last 6 - 12 hours (Recommended default) | How recent scaling activity aligns with workload behavior and resource usage | - May not reveal daily patterns or long-term trends |
| - Post-incident analysis - Validating autoscaling behavior under normal load cycles - Comparing day vs night behavior | Last 1- 3 days | Whether scaling behavior is consistent, cyclical, or noisy over normal operating conditions | - Individual events become less prominent - Requires aggregation to stay readable |
| - Capacity planning - Cost and efficiency analysis - Detecting slow growth or configuration drift | Last 1 - 4 weeks | Long-term changes in baseline Pod count and sustained scaling trends | - Not useful for live troubleshooting - Brief Pod count spikes may not be visible unless peak or step changes are preserved |
Was this page helpful?
Related resources from Grafana Labs


