Upgrade Kubernetes Monitoring
Choose the following instructions appropriate for your existing configuration of Kubernetes Monitoring.
Update Kubernetes Monitoring features
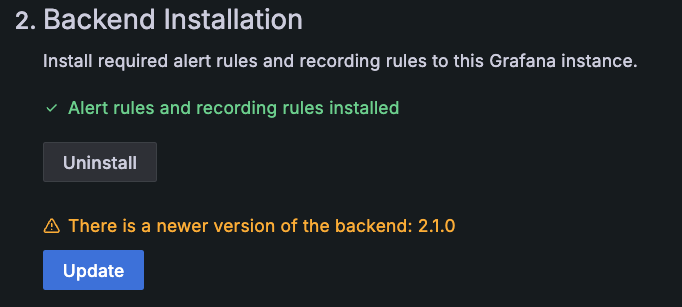
When a new version of alerting rules and recording rules becomes available, an Update button is available within step 2 of the configuration steps on the Cluster configuration tab. Migration is not incremental. You are updated to the latest version.
To upgrade and install the latest alerting and recording rules to your Grafana instance, click Update on the Cluster configuration tab.

If you receive an error that the upgrade has failed, refer to troubleshooting instructions.
Upgrade to version 2
Beginning with version 2.0.0, the kubernetes-mixin dashboards are no longer available. The remaining changes from version 1.0 to 2.0 added:
- New recording and alert rules
- The Cluster label to all alert descriptions wherever it was missing
For more information about each release, refer to release notes.
What to expect
When you upgrade, this affects the Alerts due to the updates in the definitions.
The Grafana Cloud Alerting namespace known as integrations-kubernetes is deleted and then recreated based on the latest definitions.
To view what could be deleted:
- Navigate in Grafana Cloud to Alerts & IRM > Alerting > Alert rules.
- Select your provisioned metrics data source.
- Search for
namespace:integrations-kubernetes.
Any custom or modified alert or recording rules under the Alerting namespace are deleted. If you have made any customizations, move them to a different Alerting namespace to prevent those rules from being deleted by the upgrade process.
As alert rules are recreated, the for interval accumulation is reset.
That means firing alerts may appear to resolve and then return to the firing state only if the for interval is breached again (counting from the point of alert rule recreation).
Also refer to the breaking change announcements for the Helm chart.
Testing the upgrade
- Click the Update button on the Cluster configuration tab to automatically recreate the recording and alert rules. Some alert descriptions may now contain more detail, and some new recording and alert rules appear. Some rule groups may be split or combined to improve evaluation performance.
- Check the firing Kubernetes integration alerts before during and after the upgrade using the following PromQL query in Explore against your provisioned metrics datasource:
sum(ALERTS{alertname=~"Kube.*|CPUThrottlingHigh", alertstate="firing"}). You can expect firing alerts to drop and return to somewhere near the previous value (or higher due to new alert rules being added) in the subsequent 15 to 20-minute period. - Check that the recording rule
sum(node_namespace_pod_container:container_memory_working_set_bytes)continues to have data in Explore before, during, and after the upgrade.
These items should not be affected by the upgrade:
- Dashboards
- Metrics ingestion
- Any other integrations
Cardinality
Refer to Check cardinality.
Check cardinality
As a best practice after upgrading and to ensure the gathered metrics are what you expect, check the current metrics usage and associated costs from the billing and usage dashboard located in your Grafana instance.
Refer to Metrics management and control for more details.


