Pinecone integration for Grafana Cloud
Pinecone is a serverless vector database designed for building AI applications. It provides long-term memory for AI systems, enabling semantic search, similarity search, and retrieval-augmented generation (RAG) workflows. This integration monitors Pinecone serverless indexes using Pinecone’s built-in Prometheus exporter.
This integration requires a Pinecone Standard or Enterprise plan.
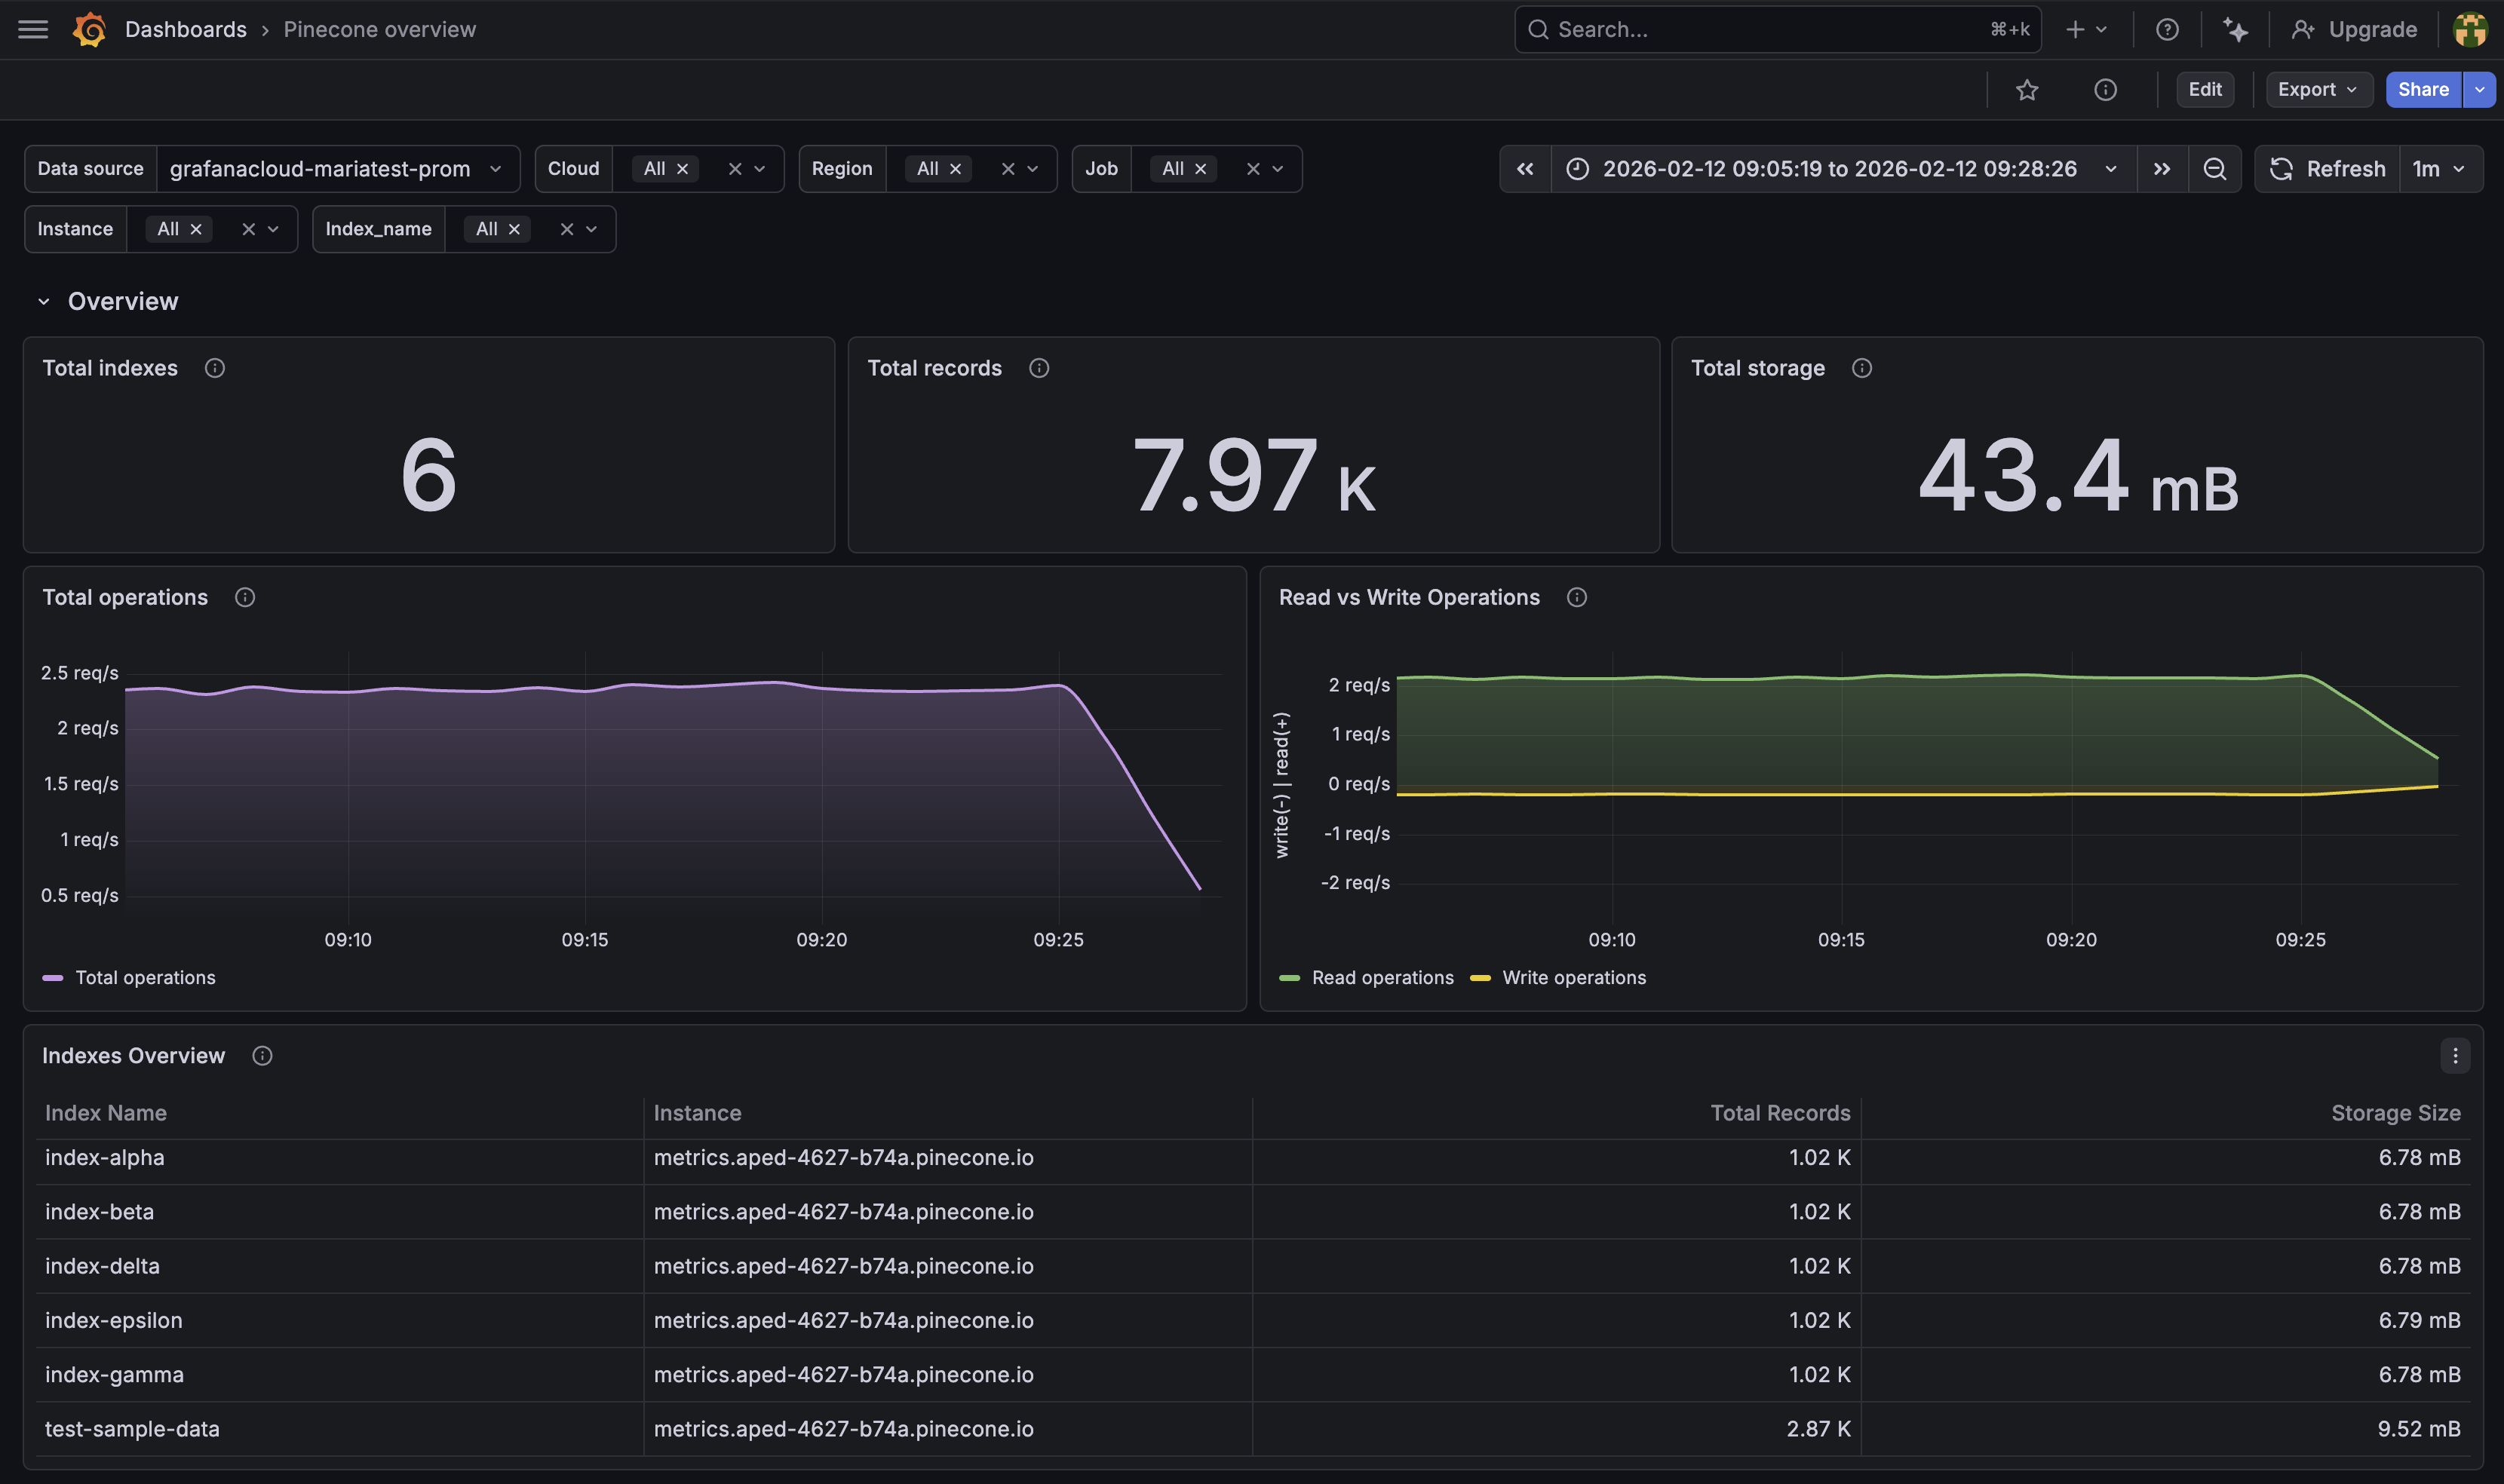
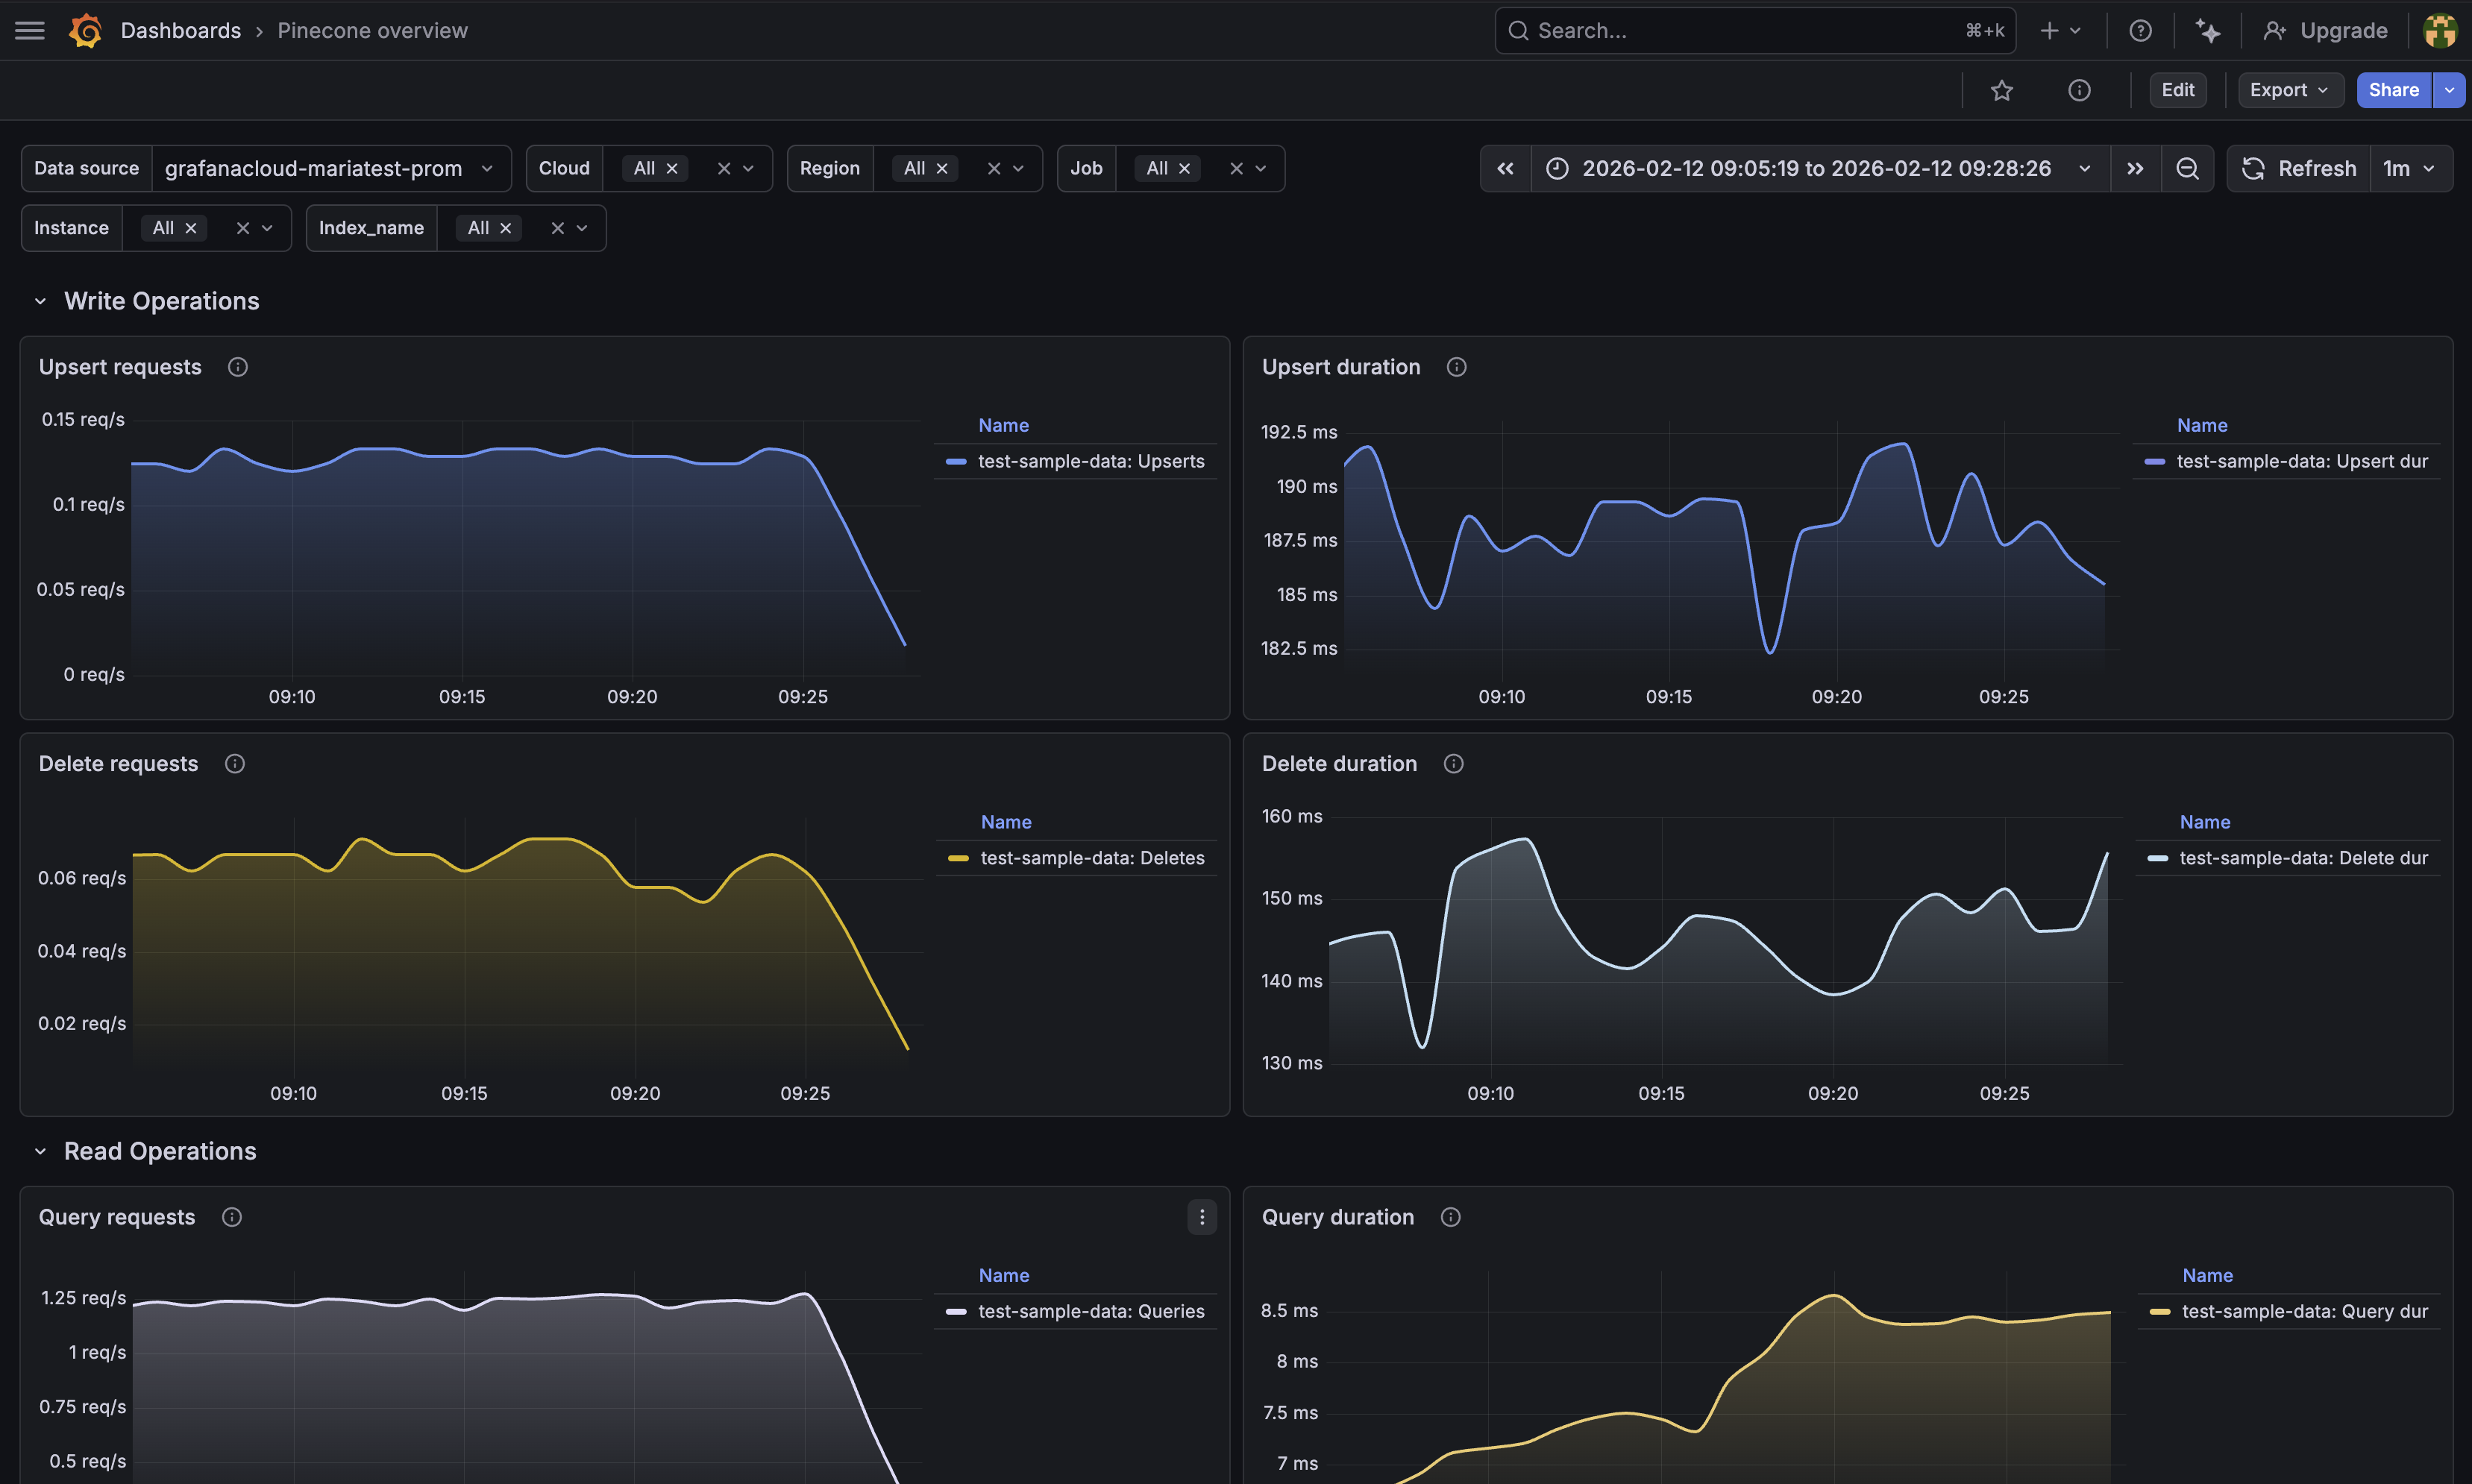
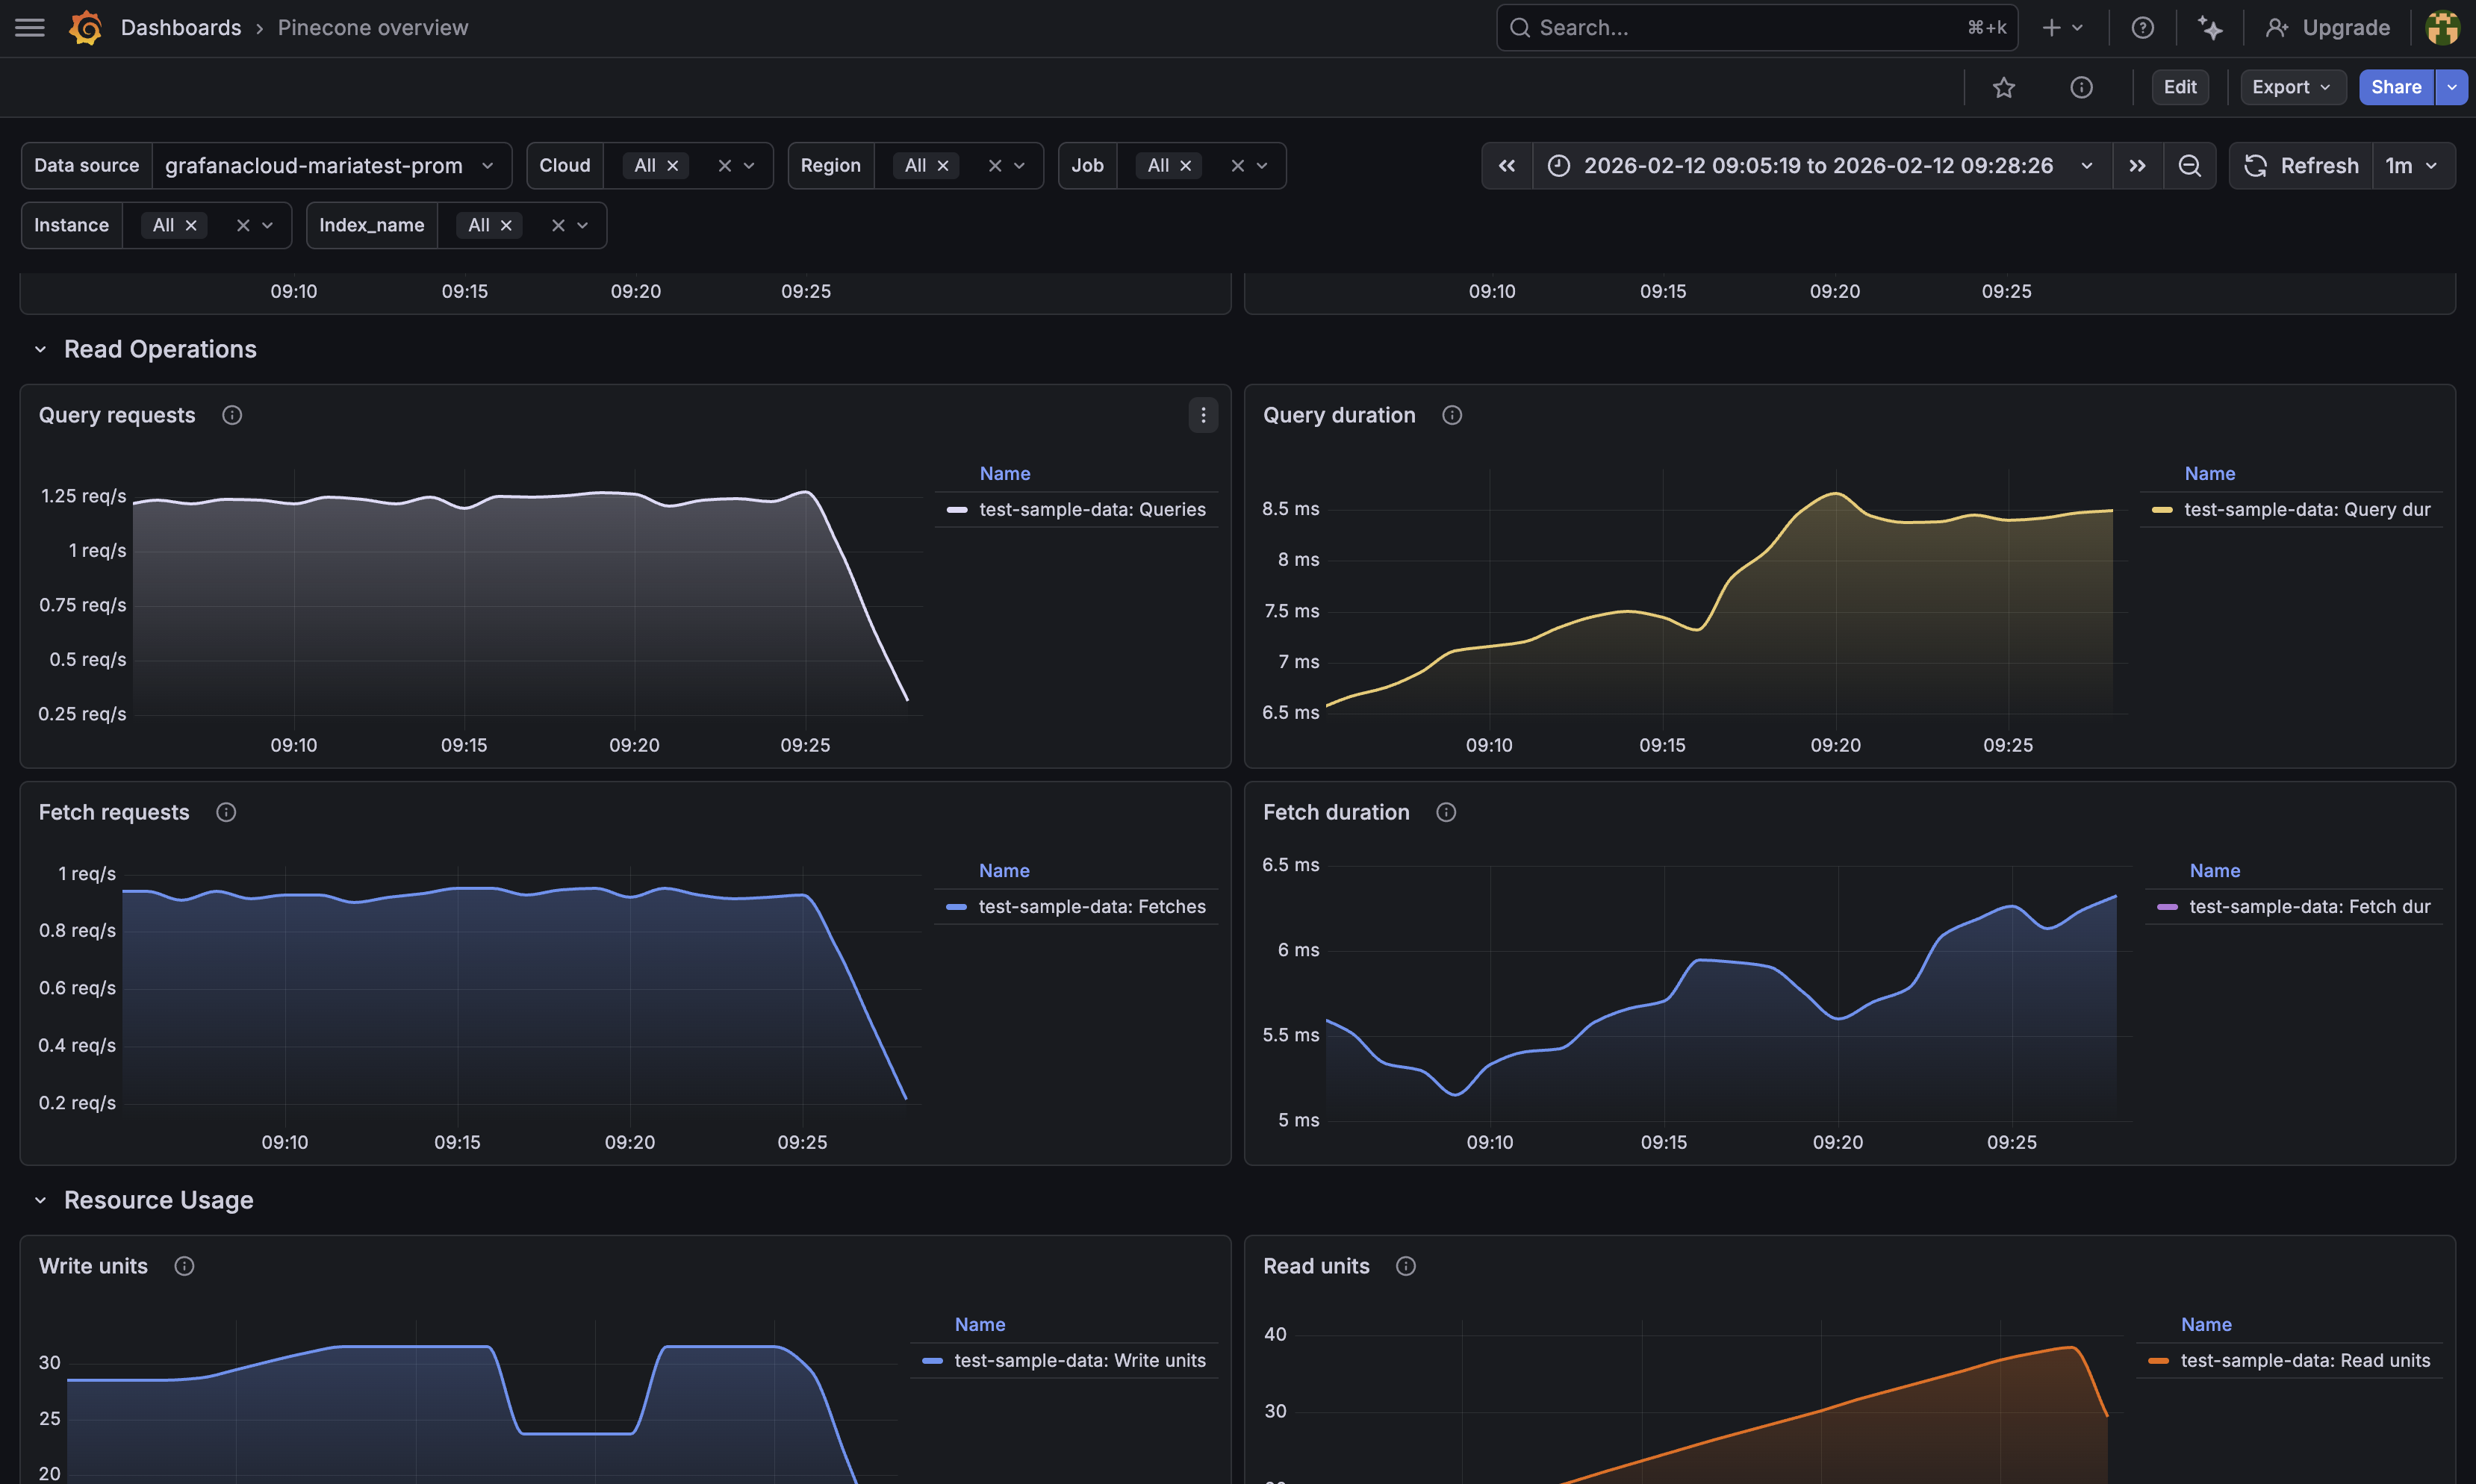
This integration includes 5 useful alerts and 1 pre-built dashboard to help monitor and visualize Pinecone metrics.
Before you begin
Prerequisites
- A Pinecone Standard or Enterprise plan.
- A Pinecone API key. Create one in the Pinecone console under API Keys.
- Your Pinecone project ID (found in the console URL or in project settings).
Metrics
Pinecone exposes metrics via its built-in Prometheus exporter. The integration uses HTTP discovery to find scrape targets from the Pinecone API. No exporter or extra components need to be run; configuration is done in Grafana Alloy.
Install Pinecone integration for Grafana Cloud
- In your Grafana Cloud stack, click Connections in the left-hand menu.
- Find Pinecone and click its tile to open the integration.
- Review the prerequisites in the Configuration Details tab and set up Grafana Alloy to send Pinecone metrics to your Grafana Cloud instance.
- Click Install to add this integration’s pre-built dashboard and alerts to your Grafana Cloud instance, and you can start monitoring your Pinecone setup.
Configuration snippets for Grafana Alloy
Simple mode
These snippets use HTTP discovery to find Pinecone scrape targets from the Pinecone API.
Replace <your-project-id> with your Pinecone project ID and <your-api-key> with your API key in the snippet below.
Manually copy and append the following into your Alloy configuration file.
Integrations snippets
discovery.http "pinecone" {
  url = "https://api.pinecone.io/prometheus/projects/<your-project-id>/metrics/discovery"
  refresh_interval = "1m"
  authorization {
    type = "Bearer"
    credentials = "<your-api-key>"
  }
}

prometheus.scrape "pinecone" {
  targets    = discovery.http.pinecone.targets
  forward_to = [prometheus.remote_write.metrics_service.receiver]
  job_name   = "integrations/pinecone"
}
Dashboards
The Pinecone integration installs the following dashboards in your Grafana Cloud instance to help monitor your system.
- Pinecone overview
Pinecone overview

Pinecone overview write operations

Pinecone overview read operations

Alerts
The Pinecone integration includes the following useful alerts:
Metrics
The most important metrics provided by the Pinecone integration, which are used on the pre-built dashboard and Prometheus alerts, are as follows:
- pinecone_db_op_delete_count
- pinecone_db_op_delete_duration_sum
- pinecone_db_op_fetch_count
- pinecone_db_op_fetch_duration_sum
- pinecone_db_op_query_count
- pinecone_db_op_query_duration_sum
- pinecone_db_op_upsert_count
- pinecone_db_op_upsert_duration_sum
- pinecone_db_read_unit_budget
- pinecone_db_read_unit_count
- pinecone_db_record_total
- pinecone_db_storage_size_bytes
- pinecone_db_write_unit_budget
- pinecone_db_write_unit_total
- up
Changelog
# 1.0.0 - February 2026

* Initial release
Cost
By connecting your Pinecone instance to Grafana Cloud, you might incur charges. To view information on the number of active series that your Grafana Cloud account uses for metrics included in each Cloud tier, see Active series and dpm usage and Cloud tier pricing.


