
Cloudflare Workers integration for Grafana Cloud
This integration provides deep observability into your Cloudflare Workers by automatically collecting OpenTelemetry traces and structured logs. Data is sent directly from Cloudflare Workers, configured through the Cloudflare Workers Observability section.
Install Cloudflare Workers integration for Grafana Cloud
- In your Grafana Cloud stack, click Connections in the left-hand menu.
- Find and select the Cloudflare Workers tile to open the integration.
- Follow the steps outlined on the Configuration page to connect your Cloudflare account and configure destinations for traces and logs.
- Once configuration is complete, click Install to add the prebuilt dashboards to your Grafana Cloud instance.
Configuration
The Cloudflare Workers integration sends traces and logs to Grafana Cloud via OpenTelemetry (OTLP).
You can configure multiple Workers to send data to a single Grafana Cloud instance.
Configure the integration
Follow these steps to set up Cloudflare Workers for Grafana Cloud:
Create Grafana Cloud Token
- Generate a Grafana Cloud Access Policy Token with the permissions listed above.
- Copy the token value and store it securely.
Navigate to Cloudflare Workers Observability
- In your Cloudflare dashboard, go to the Workers Observability page.
Configure Trace Destination
- Add a new destination for traces with the following details:
- Destination URL:
<your grafana-cloud-otlp-endpoint>/v1/traces. You can find this endpoint by following the steps in this guide. - Auth Header Name:
Authorization - Auth Header Value:
Bearer <your-grafana-token>
- Destination URL:
- Add a new destination for traces with the following details:
Configure Logs Destination
- Add a new destination for logs with the following details:
- Destination URL:
<your grafana-cloud-otlp-endpoint>/v1/logs. You can find this endpoint by following the steps in this guide. - Auth Header Name:
Authorization - Auth Header Value:
Bearer <your-grafana-token>
- Destination URL:
- Add a new destination for logs with the following details:
Configure Your Worker
- With your destination created in the Cloudflare dashboard, update your Worker’s configuration to enable telemetry export.
Add the following to worker wrangler.jsonc
{
    "observability": {
        "traces": {
        "enabled": true,
        // Must match the destination name in the dashboard
        "destinations": ["grafana-traces"]
        },
        "logs": {
        "enabled": true,
        // Must match the destination name in the dashboard
        "destinations": ["grafana-logs"]
        }
    }
}
or
add the following to the worker wrangler.toml
[observability.traces] enabled = true destinations = [ "grafana-traces" ] [observability.logs] enabled = true destinations = [ "grafana-logs" ]- After updating your configuration, deploy your Worker for the changes to take effect. It may take a few minutes after deployment for data to appear in Grafana Cloud.
Install Dashboards
- Click Install to add the Cloudflare Workers dashboards to your Grafana Cloud instance.
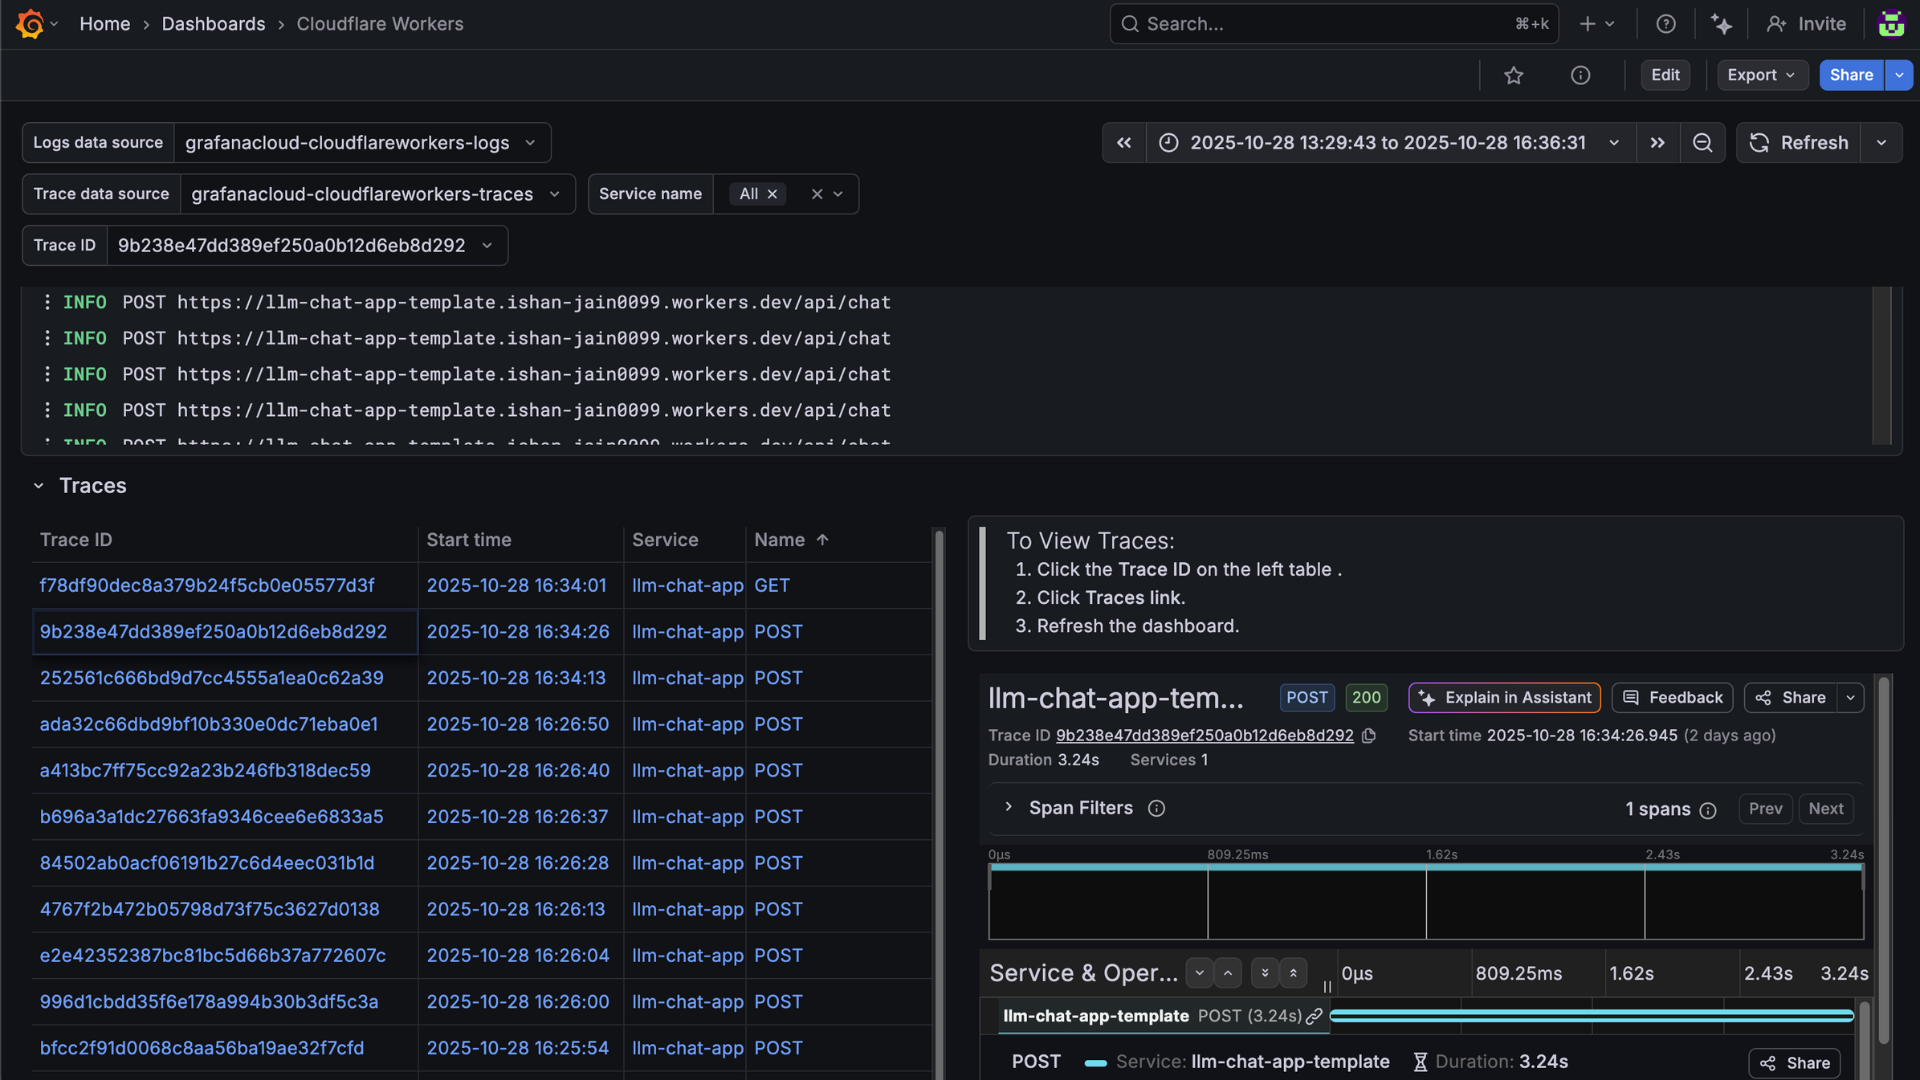
Dashboards
The Cloudflare Workers integration installs the following dashboards in your Grafana Cloud instance.
- Cloudflare Workers
Cloudflare workers overview
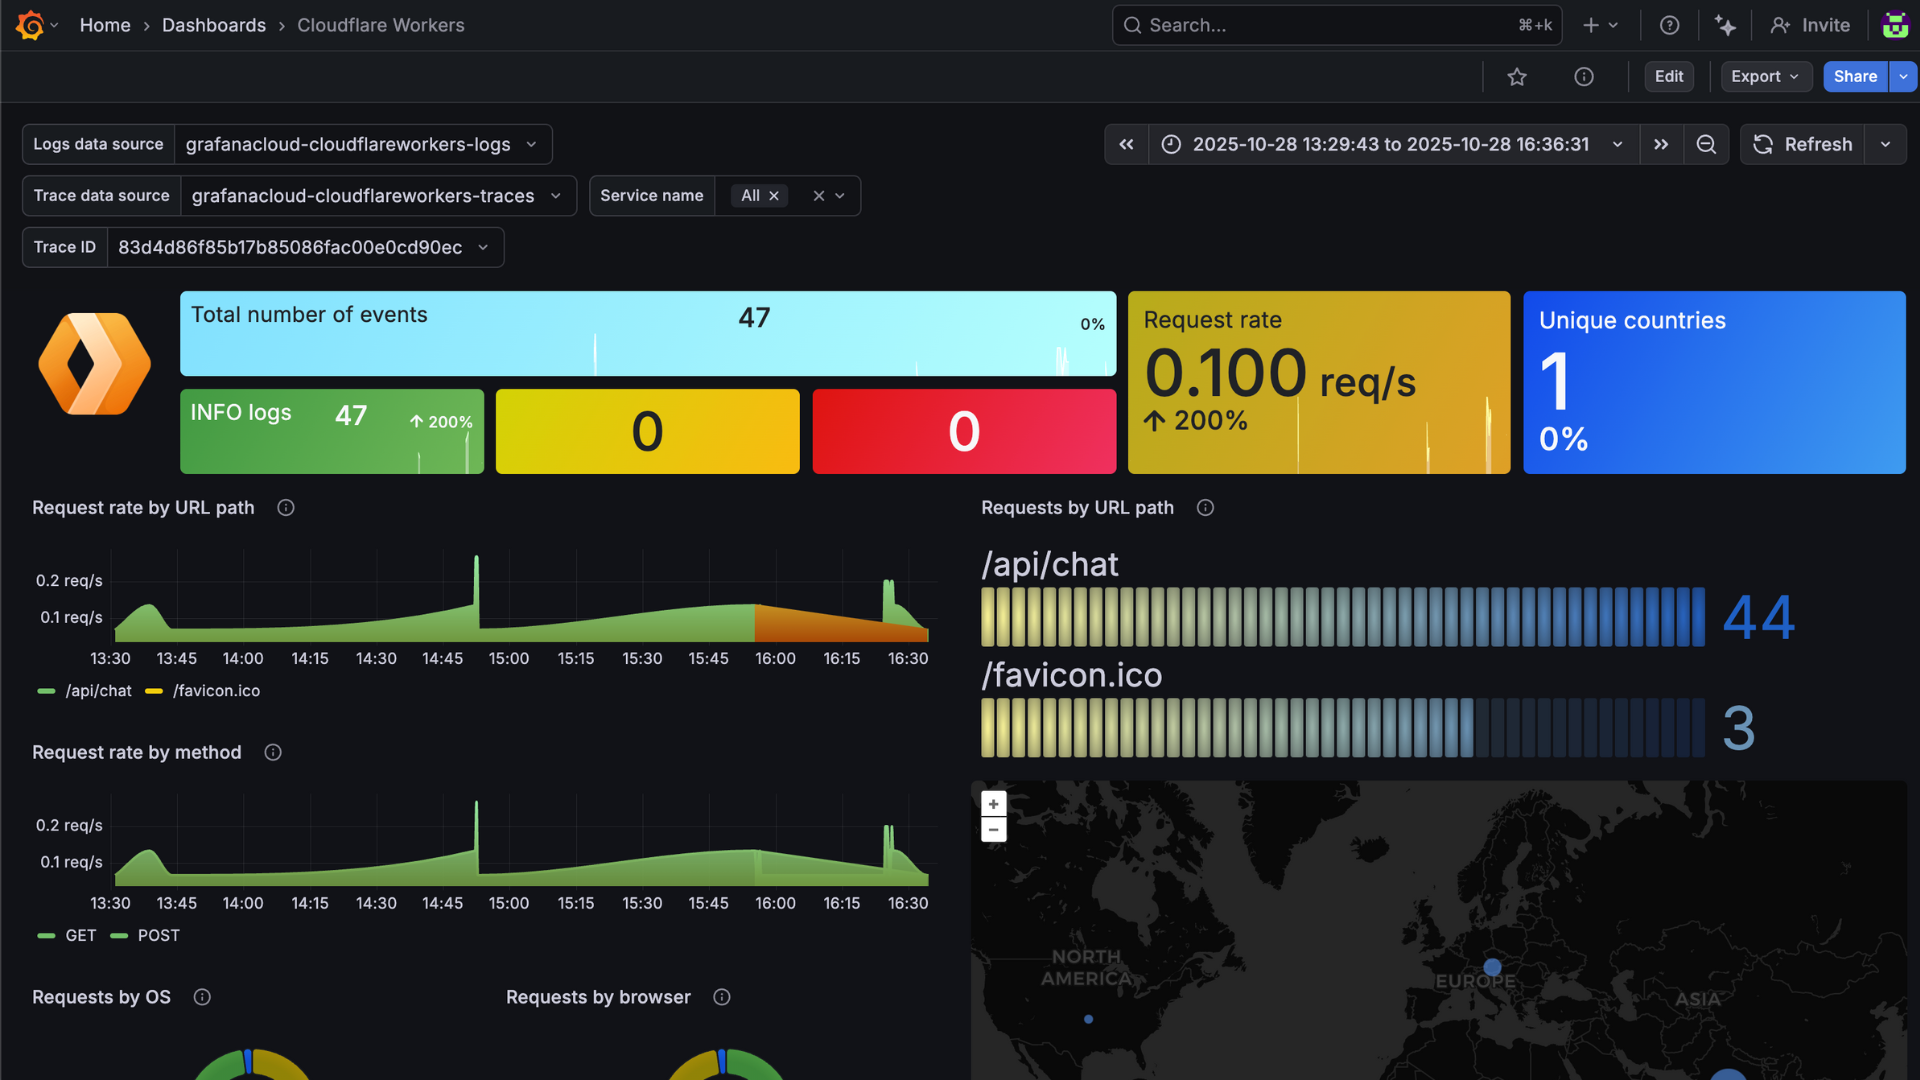
Cloudflare workers logs
Changelog
# 1.0.0 - October 2025

* Initial release of Cloudflare Workers integration
* OTLP endpoint configuration for traces and logs
* Basic setup instructions and documentation

