Claude Code integration for Grafana Cloud
Track Claude Code usage, costs, and tool activity across your organization by exporting telemetry data through OpenTelemetry (OTel). Claude Code exports metrics as time series data via the standard metrics protocol, and events via the logs/events protocol.
Install Claude Code integration for Grafana Cloud
- In your Grafana Cloud stack, click Connections in the left-hand menu.
- Find and select the Claude Code tile to open the integration.
- Follow the steps outlined on the Configuration page to set up telemetry and configure credentials.
- Once configuration is complete, click Install to add the prebuilt dashboards to your Grafana Cloud instance.
Configuration
The Claude Code integration sends metrics and logs to Grafana Cloud via OpenTelemetry (OTLP). You can configure telemetry for an individual developer or deploy organisation-wide via managed settings.
Configure the integration
Follow these steps to set up Claude Code for Grafana Cloud:
Create Grafana Cloud Token
- Generate a Grafana Cloud Access Policy Token with
metrics:writeandlogs:writepermissions. - Copy the token value and store it securely.
- Generate a Grafana Cloud Access Policy Token with
Set Up Claude Code Telemetry
Individual — Terminal (Quickstart)
Add the following to your shell profile (
.bashrc,.zshrc) or paste directly into your terminal:export CLAUDE_CODE_ENABLE_TELEMETRY=1 export OTEL_METRICS_EXPORTER=otlp export OTEL_LOGS_EXPORTER=otlp export OTEL_EXPORTER_OTLP_PROTOCOL=http/protobuf export OTEL_EXPORTER_OTLP_ENDPOINT=<your-grafana-cloud-otlp-endpoint> export OTEL_EXPORTER_OTLP_HEADERS="Authorization=Basic <base64-encoded-instanceid:token>" export OTEL_EXPORTER_OTLP_METRICS_TEMPORALITY_PREFERENCE=cumulativeRestart Claude Code after updating your shell profile for changes to take effect.
Individual — Config File (Recommended)
Run
claude settingsor open~/.claude/settings.jsonand add the following:{ "env": { "CLAUDE_CODE_ENABLE_TELEMETRY": "1", "OTEL_METRICS_EXPORTER": "otlp", "OTEL_LOGS_EXPORTER": "otlp", "OTEL_EXPORTER_OTLP_PROTOCOL": "http/protobuf", "OTEL_EXPORTER_OTLP_ENDPOINT": "<your-grafana-cloud-otlp-endpoint>", "OTEL_EXPORTER_OTLP_HEADERS": "Authorization=Basic <base64-encoded-instanceid:token>", "OTEL_EXPORTER_OTLP_METRICS_TEMPORALITY_PREFERENCE": "cumulative" } }Restart Claude Code after saving the file for changes to take effect.
Administrator — Managed Settings
Administrators can configure OpenTelemetry settings for all users through the managed settings file, allowing centralised control of telemetry across an organisation. See settings precedence for more information.
The managed settings file is located at:
- macOS:
/Library/Application Support/ClaudeCode/managed-settings.json - Linux / WSL:
/etc/claude-code/managed-settings.json
Add the following to your managed settings file:
{ "env": { "CLAUDE_CODE_ENABLE_TELEMETRY": "1", "OTEL_METRICS_EXPORTER": "otlp", "OTEL_LOGS_EXPORTER": "otlp", "OTEL_EXPORTER_OTLP_PROTOCOL": "http/protobuf", "OTEL_EXPORTER_OTLP_ENDPOINT": "<your-grafana-cloud-otlp-endpoint>", "OTEL_EXPORTER_OTLP_HEADERS": "Authorization=Basic <base64-encoded-instanceid:token>", "OTEL_EXPORTER_OTLP_METRICS_TEMPORALITY_PREFERENCE": "cumulative" } }Managed settings can be distributed via MDM (Mobile Device Management) or other device management solutions. Environment variables defined in the managed settings file have high precedence and cannot be overridden by users. See the administrator configuration docs for deployment options.
- macOS:
Install Dashboards
- Click Install to add the Claude Code dashboards to your Grafana Cloud instance.
Finding your credentials
- OTLP Endpoint: Your endpoint is displayed in the integration configuration page. You can also find it in the Grafana Cloud portal under My Account → Stack details.
- Auth Header: Use
Authorization=Basic <base64(instanceId:token)>whereinstanceIdis your Hosted Metrics instance ID andtokenis the Grafana Cloud Access Policy token generated above.
Dashboards
The Claude Code integration installs the following dashboards in your Grafana Cloud instance.
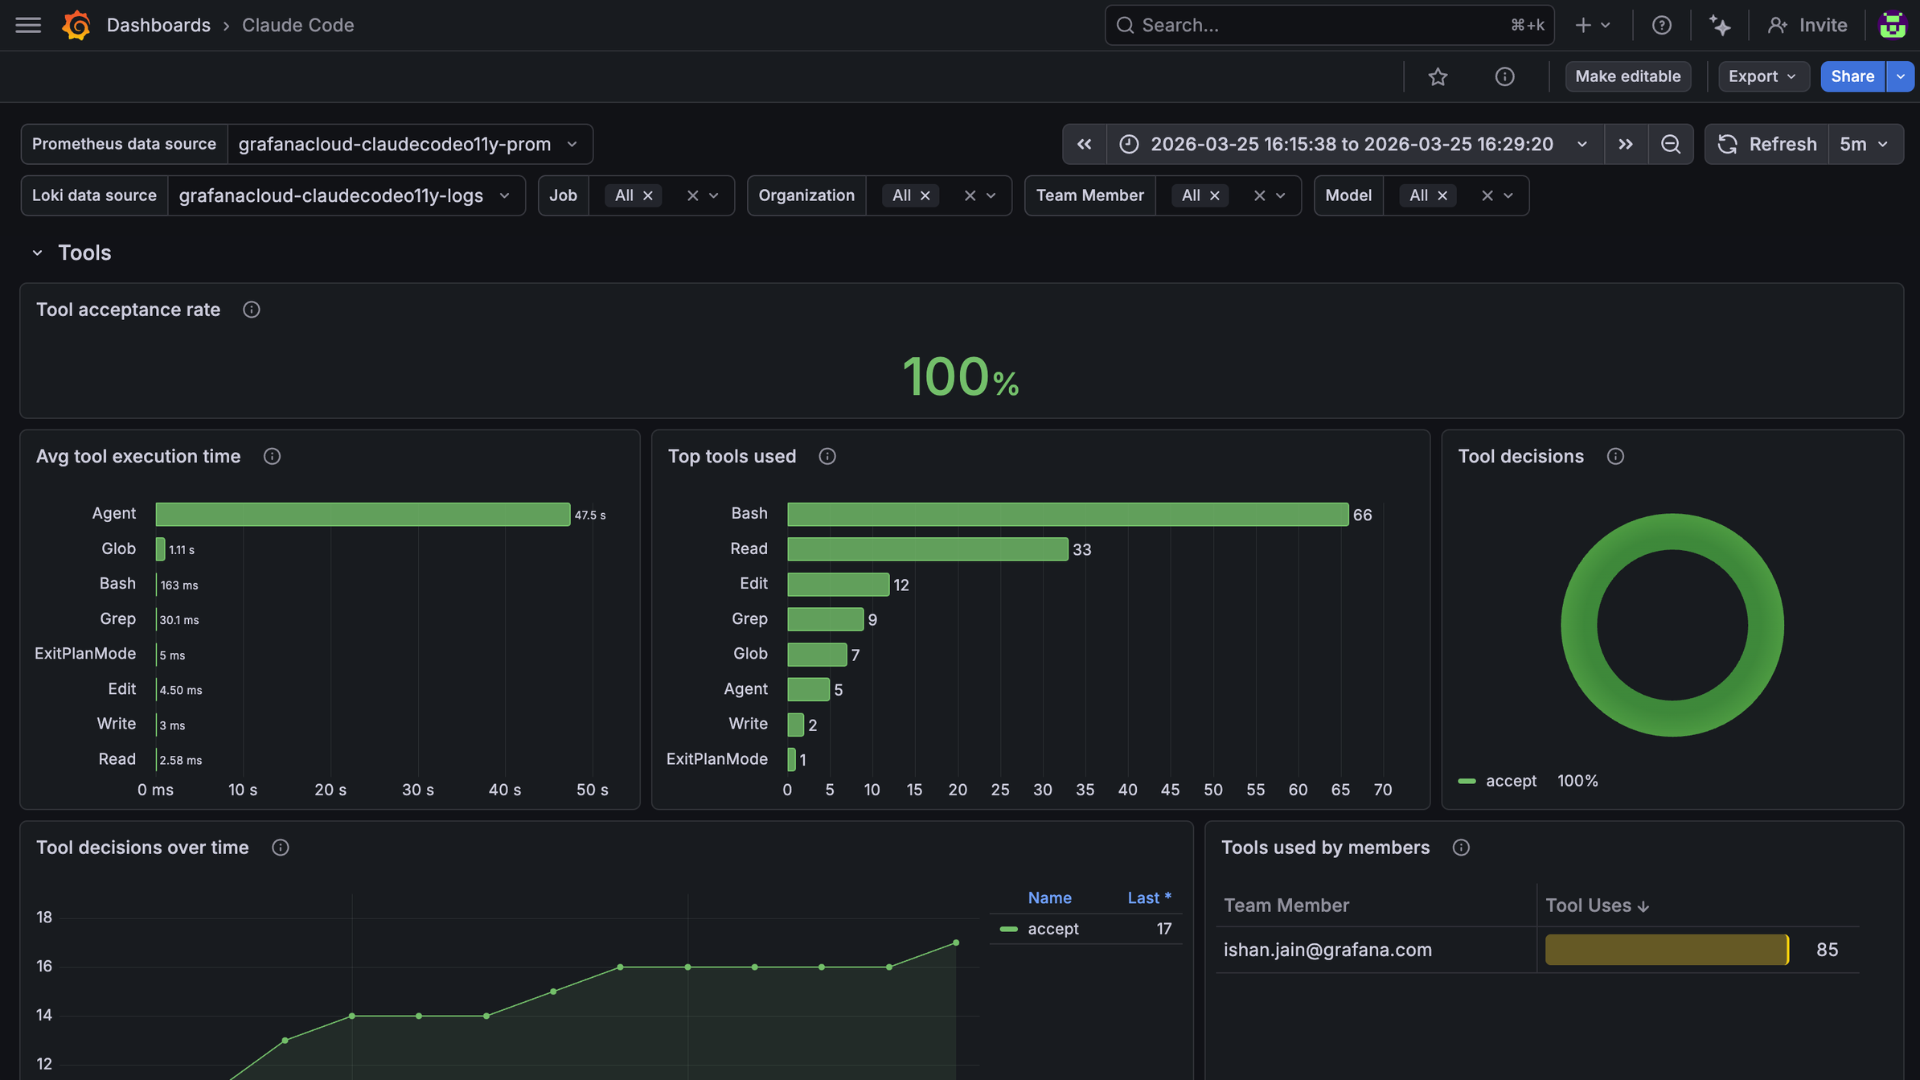
- Claude Code
Claude Code stats
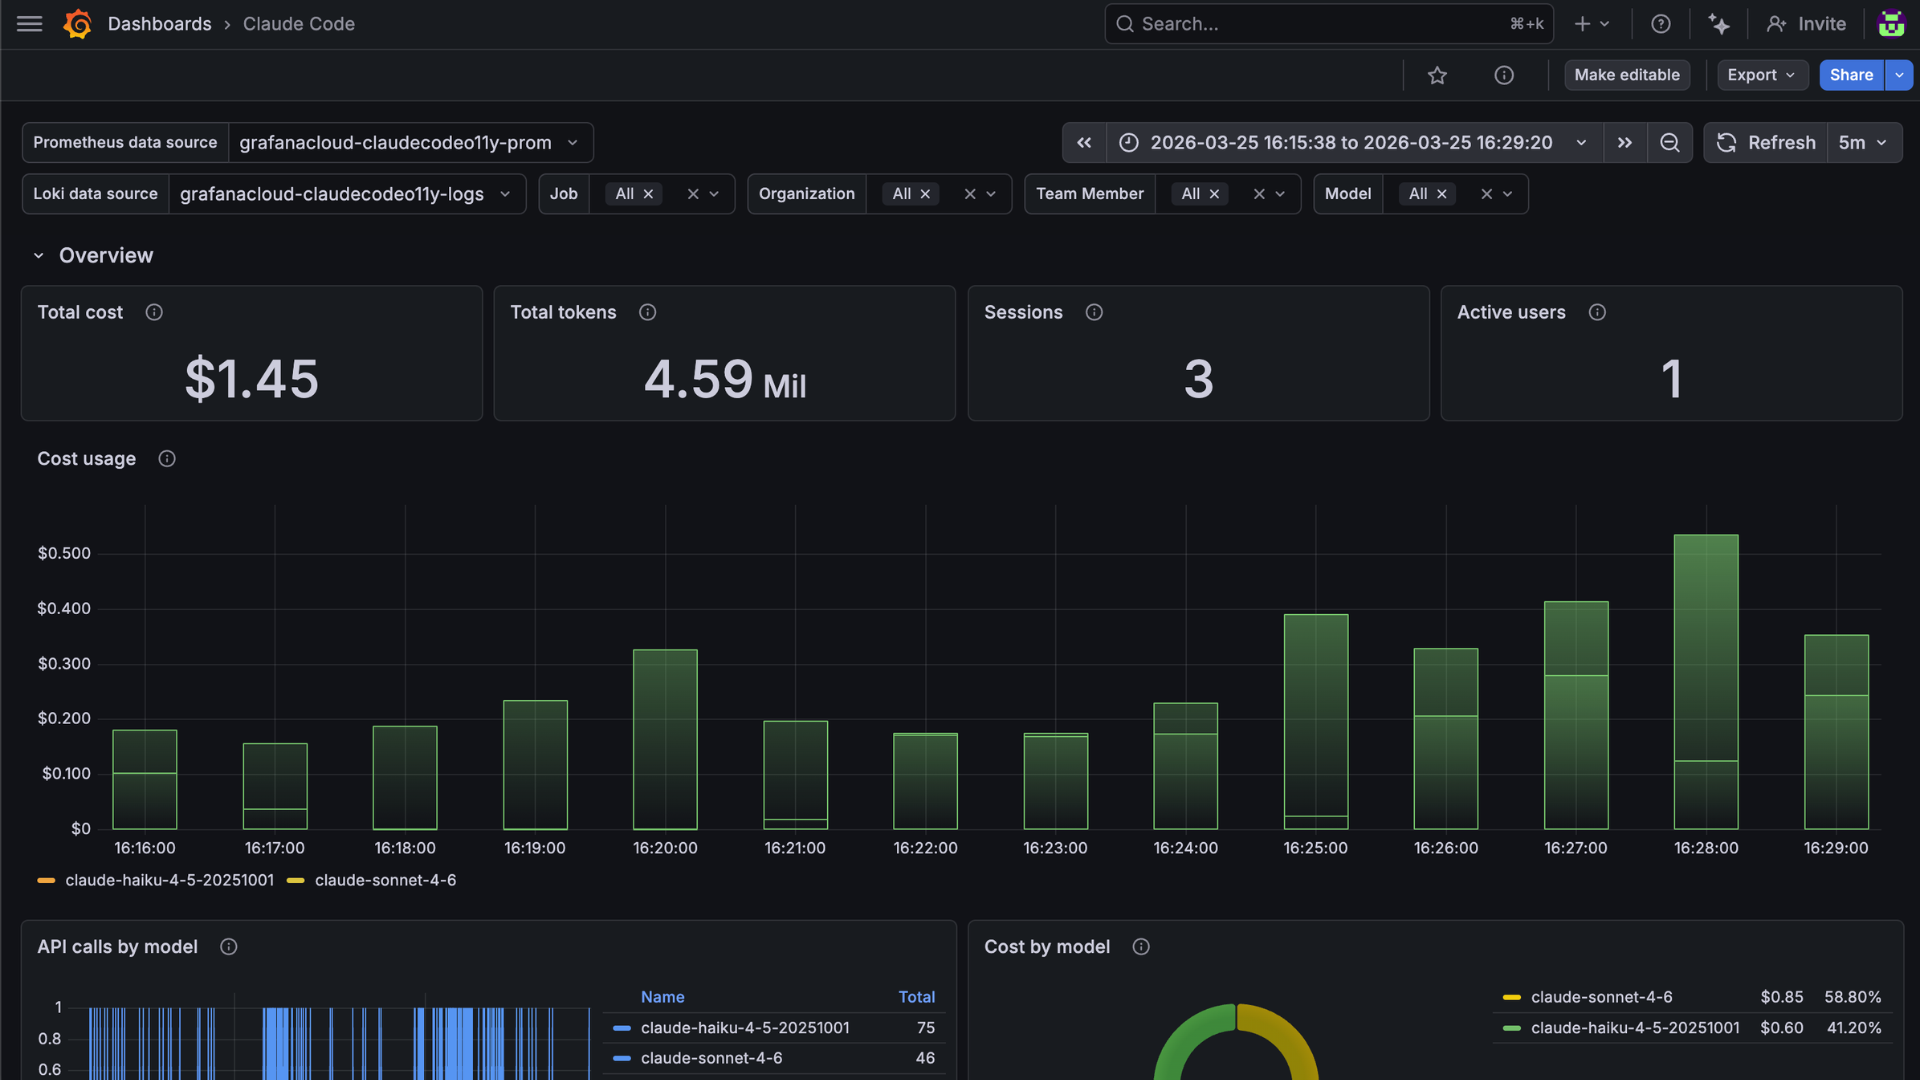
Claude Code usage breakdown
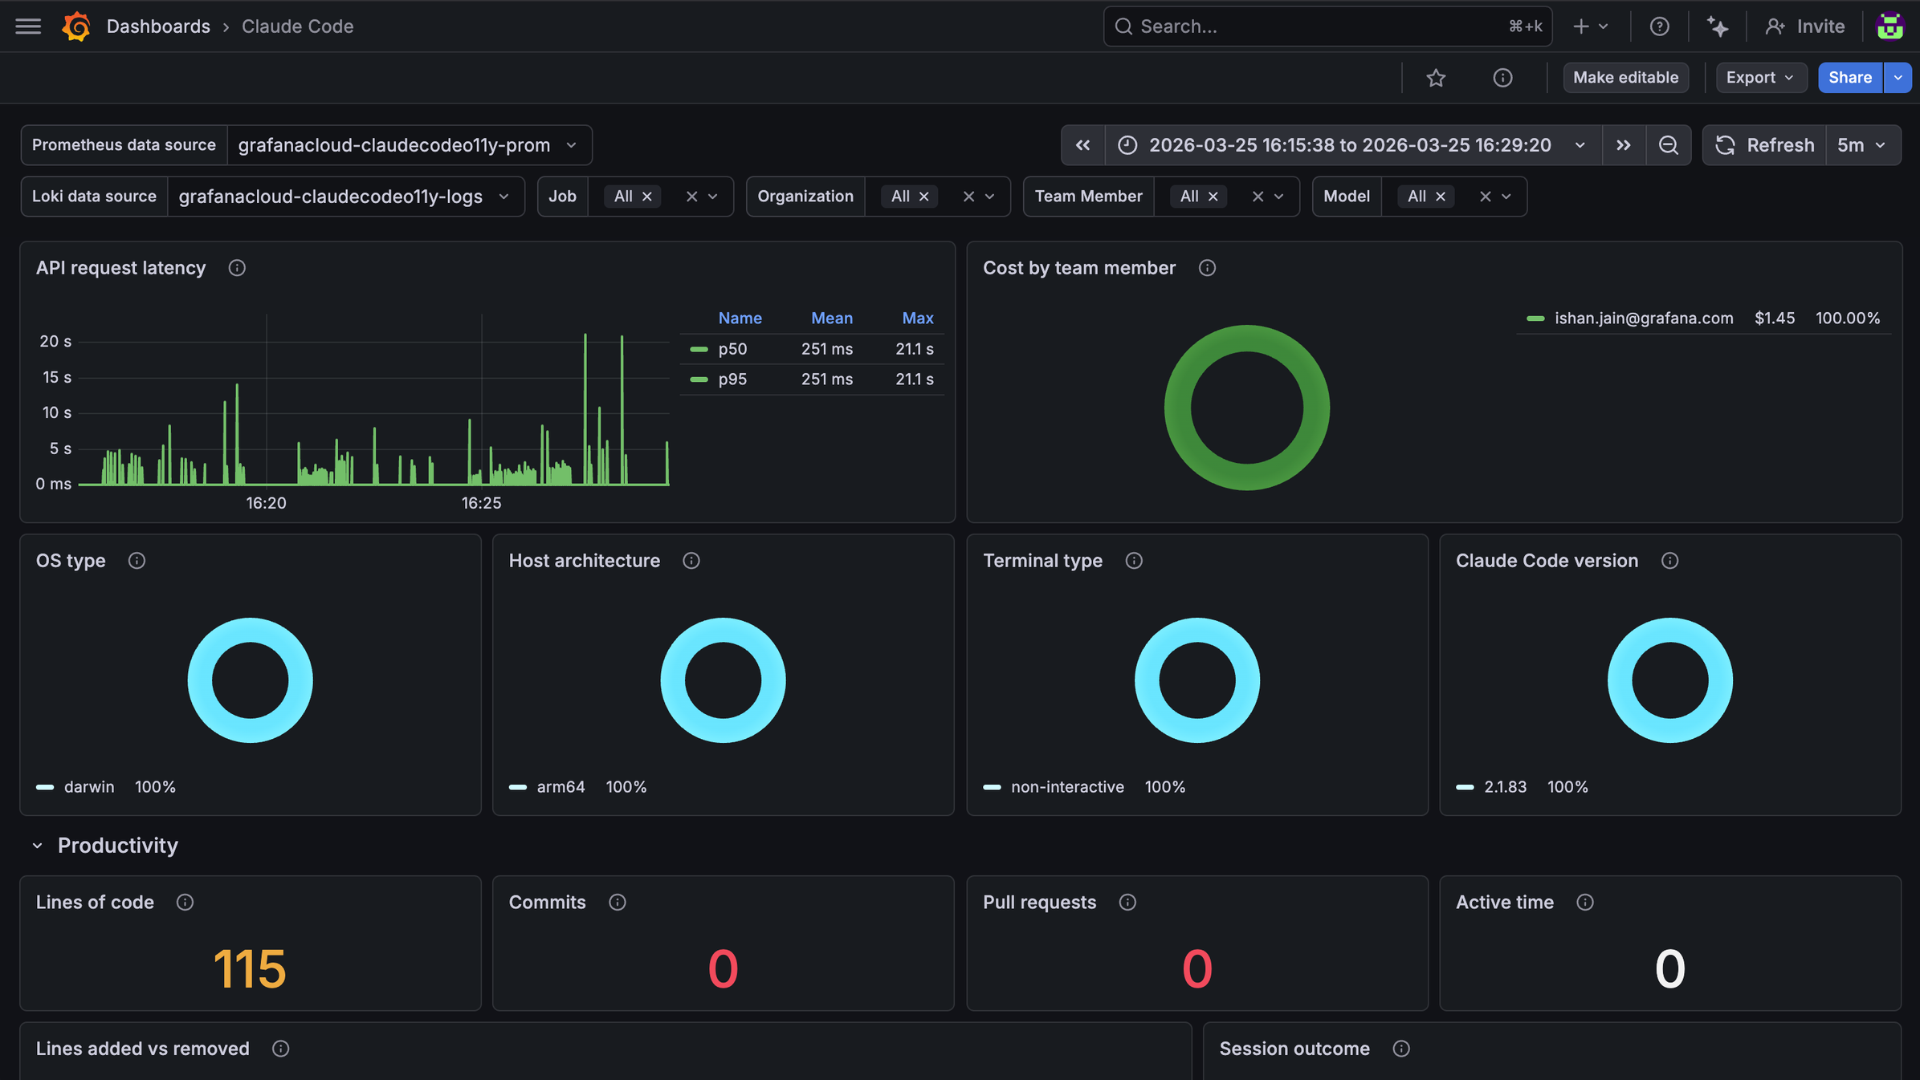
Claude Code productivity
Changelog
# 1.0.0 - March 2026

* Initial release of Claude Code integration
* OTLP endpoint configuration for metrics and logs
* Setup instructions for individual (quickstart) and team/admin configurations

