
Use recording rules
Recording rules let you store profiling data as metrics in a Prometheus data source. Querying pre-processed data from this source is especially useful for resource-intensive query workflows. Use cases include creating dashboards and alerts from profiling data, comparing performance of specific functions, and identifying services that use CVE-prone or insecure functions.
Before you begin
To use recording rules with your profile data, you need:
- A Grafana Cloud account
- Configured Cloud Metrics and Cloud Profiles data sources
How they work
You can create recording rules from the Profiles Drilldown app. Recording rules are compounded by a metric name, a profile type, a set of matchers, and some additional labels to group by.
Any ingested profiles matching the rule’s profile type and matchers are aggregated, grouped by the additional labels, and exported to your Grafana Cloud Metrics data source. The aggregation function is sum, which works best for the majority of the profile types.
Metrics are available approximately 10 seconds after being ingested. The data is exported with the timestamps at which they were ingested.
Enable recording rules in Grafana Cloud
Note
Recording rules is currently in private preview. Grafana Labs offers support on a best-effort basis, and breaking changes might occur prior to the feature being made generally available.
Recording rules are currently in private preview. Contact the support team to enable it.
After it’s enabled, create a recording rule to start exporting data.
Note
Exported data is stored in your Grafana Cloud Metrics data source, and produces extra active series that could impact your billing. For more information on billing, refer to Billing and usage.
Enable recording rules in the Profiles Drilldown app
To use recording rules in the Profiles Drilldown app, enable them in Grafana from the Drilldown > Profiles > View/edit tenant settings (Settings Icon at the top right corner).
Select the toggle Enable metrics from profiles to activate. The toggle appears blue with a check mark. Then Save settings.
Note
Changing the toggle only shows or hides the recording rules features in the UI. Any existing recording rules record until they are deleted.
Create a recording rule from the Profiles Drilldown app
After you’ve enabled recording rules in the UI, you can access the recording rules wizard from the top right corner menu or directly from a flame graph. When accessing the wizard, the context of the current visualization (Service, Profile type, Filters, and function name) is carried.
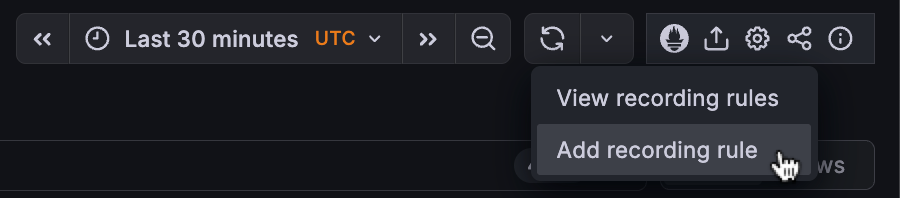
Access the recording rule creation wizard from the corner menu
You can access the wizard from the top right corner menu: click the Prometheus icon on the top menu and choose Add recording rule.
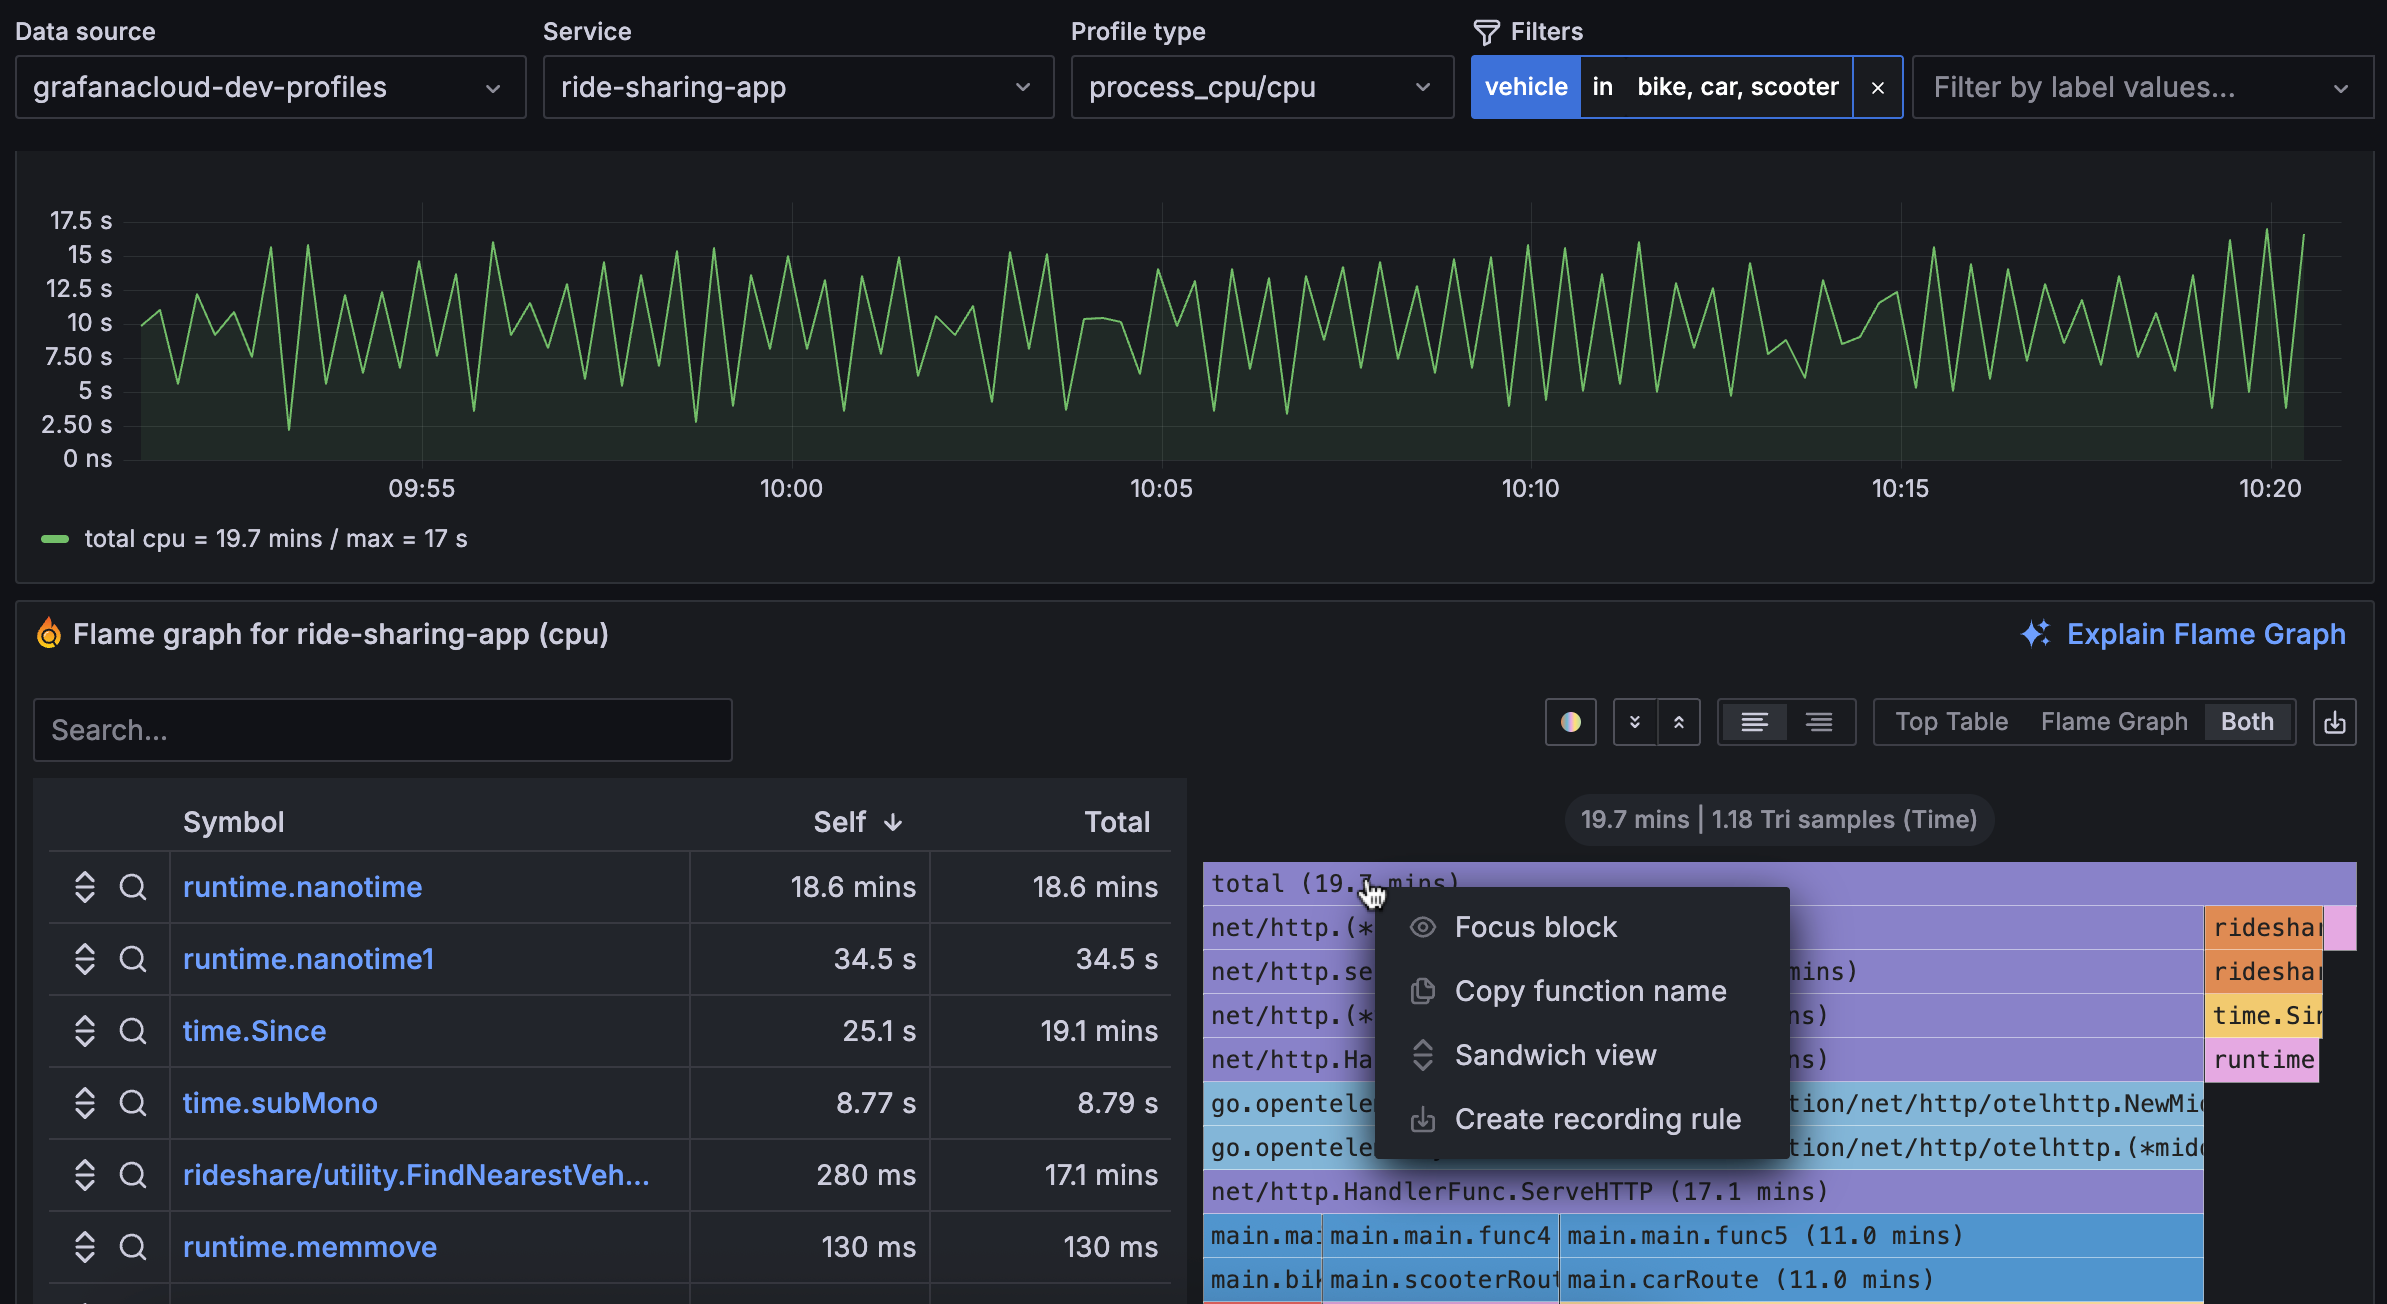
Access the recording rule creation wizard from a flame graph
To access the recording rule wizard from a flame graph:
- Click on the block that you want to record.
- Select Create recording rule.
You can choose a function block to export function totals, or use the total block if you don’t want to target a single function but the total consumption of the service.
Create a recording rule from the wizard
Follow these steps to create a recording rule:
- Choose a metric name.
- Optional: Select the additional labels to group by.
- Check that the contextual filters (service name, profile type, filters, and function name) are carried to the rule creation.
- Confirm by clicking on the Create button.
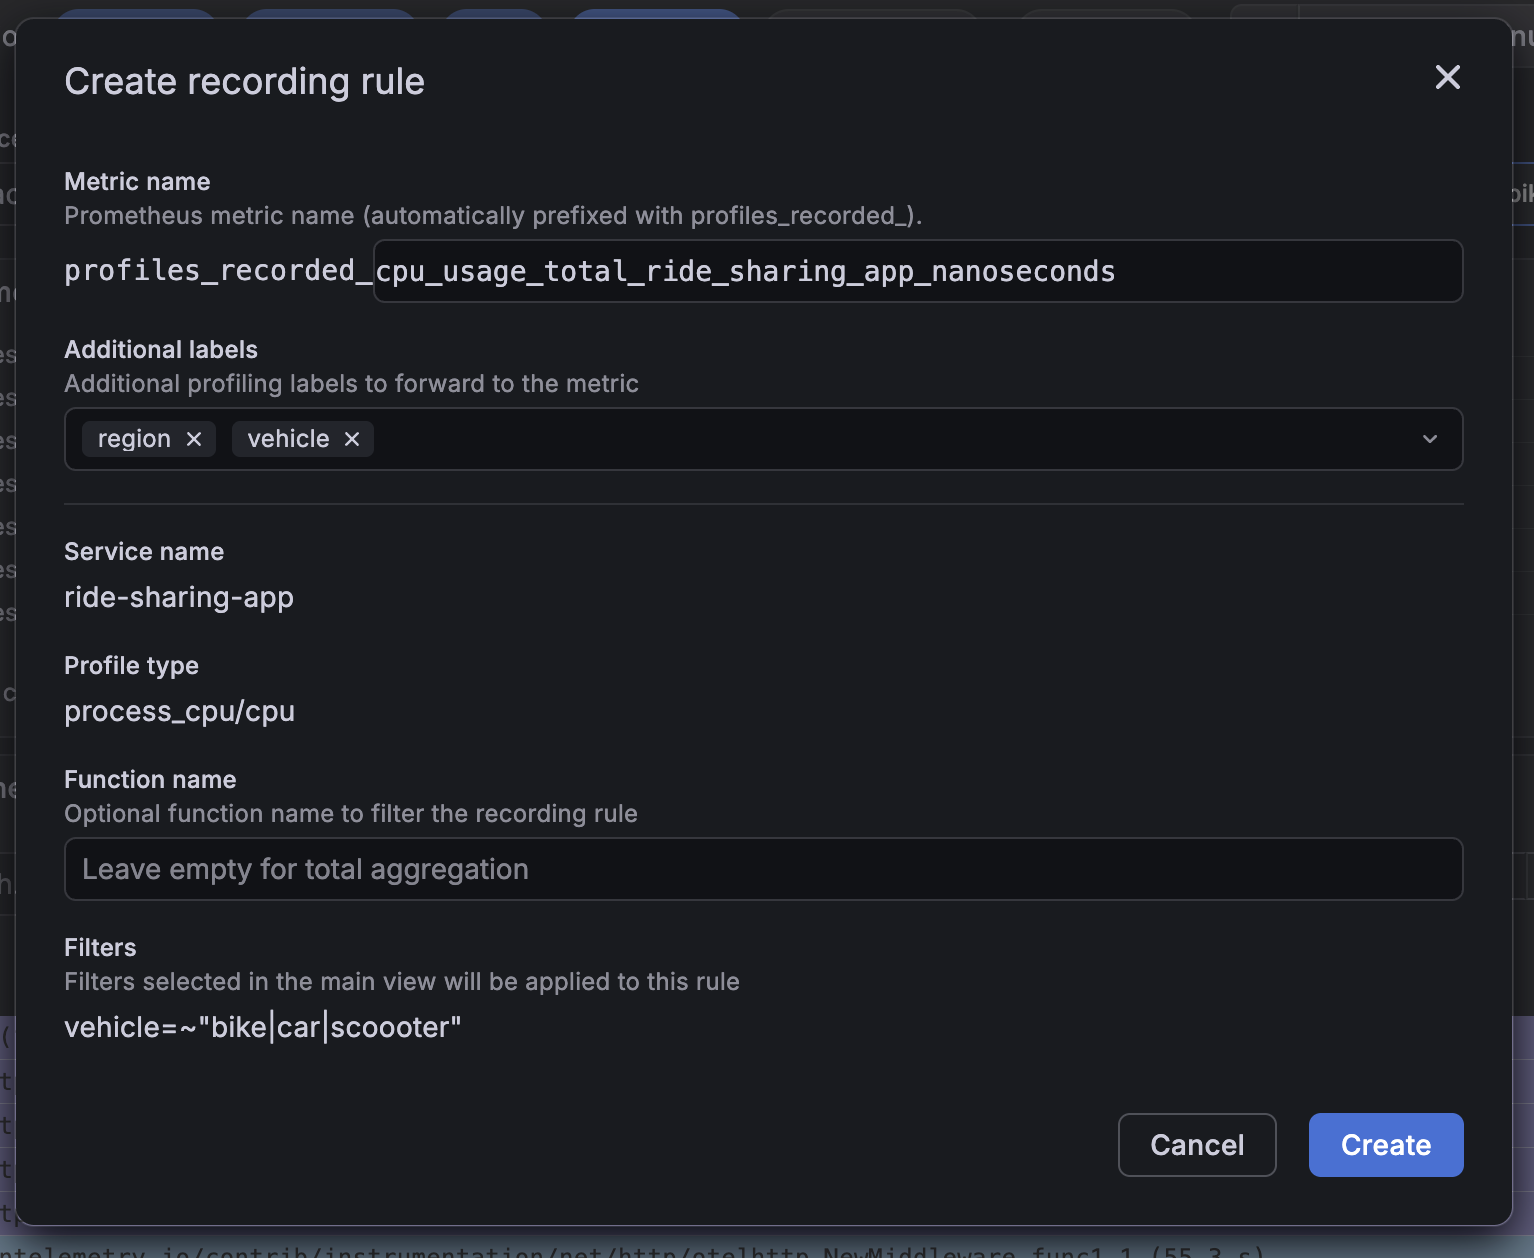
Note
Metric names must use the
profiles_recorded_prefix. Generated metrics are gauges. We recommend you following this naming convention:profiles_recorded_<profile_type>_<service_name or matchers description>_<unit>, for example:profiles_recorded_cpu_usage_function_total_garbage_collection_nanoseconds.
Read the exported metrics
After the recording rule is created, view the associated metrics in Grafana:
- Go to Explore.
- Choose your default Grafana Cloud Prometheus data source.
- Query your new metric
Note
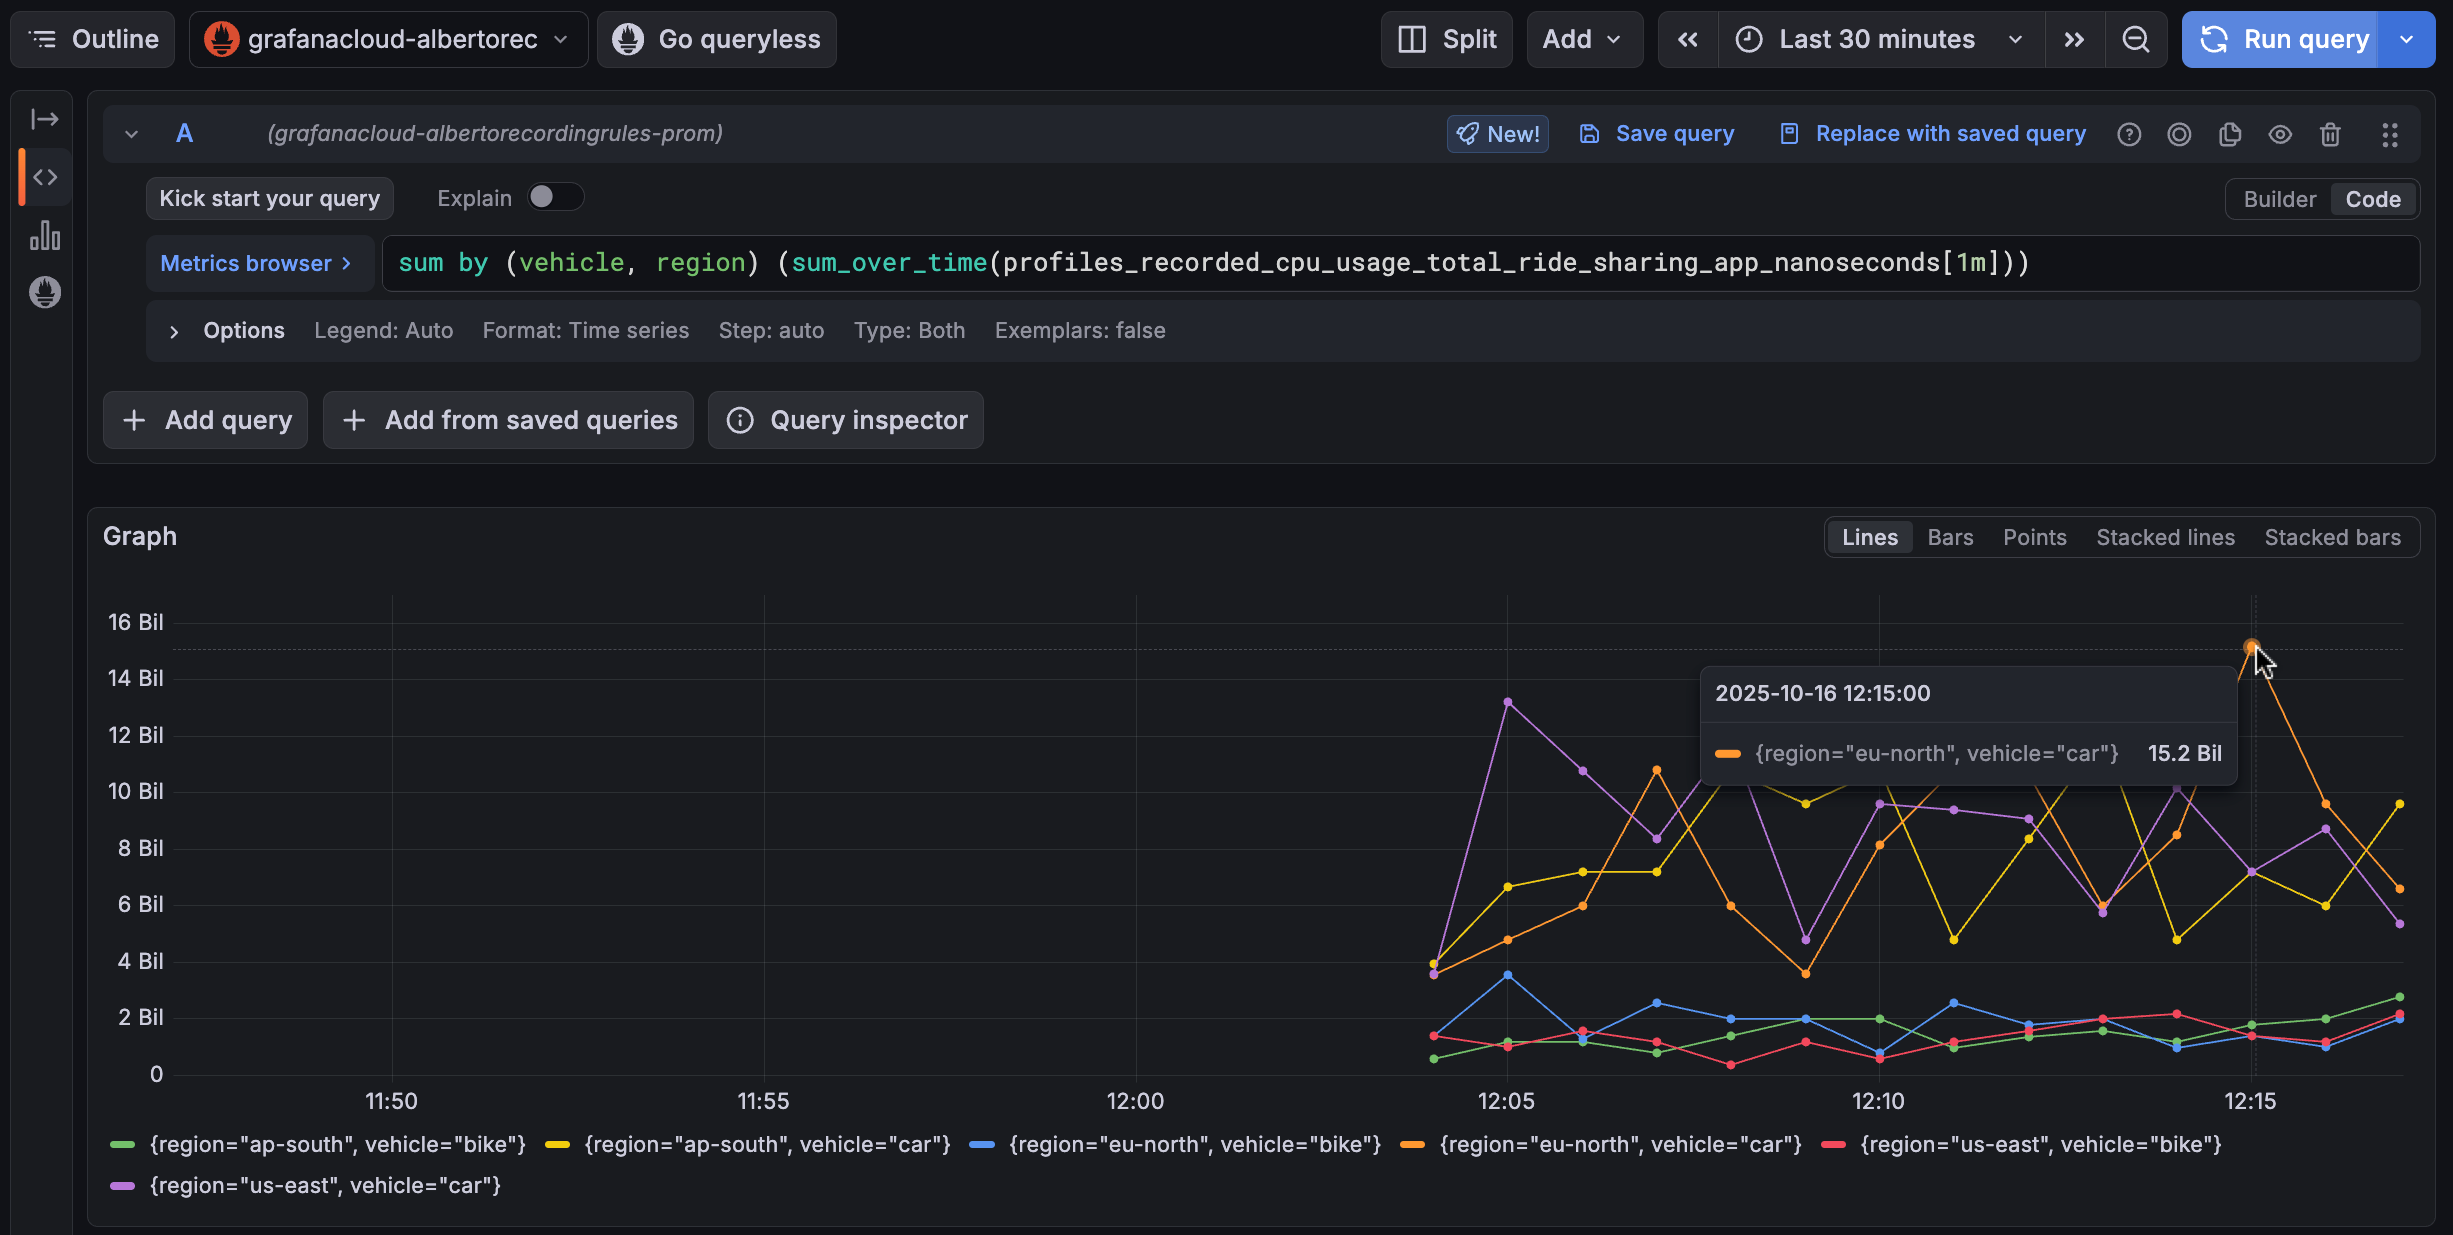
The exported metrics are gauges of the chosen resource consumption over time. Profiles aren’t necessarily ingested at a perfect rate, hence reading those gauges raw can be confusing. Use the
sum_over_timefunction to aggregate the data points within a fixed-size window to help understand the rate of consumption at that period.The following example shows a peak of 15.2s of CPU usage over a 60s window:
Example: create a dashboard and set an alert
You can also create a dashboard so you have relevant panels available:
- Go to Dashboards.
- Create a new dashboard at New > New dashboard.
- Press + Add visualization.
- Choose your default Grafana Cloud Prometheus data source.
- Start creating panels with the new exported metric.
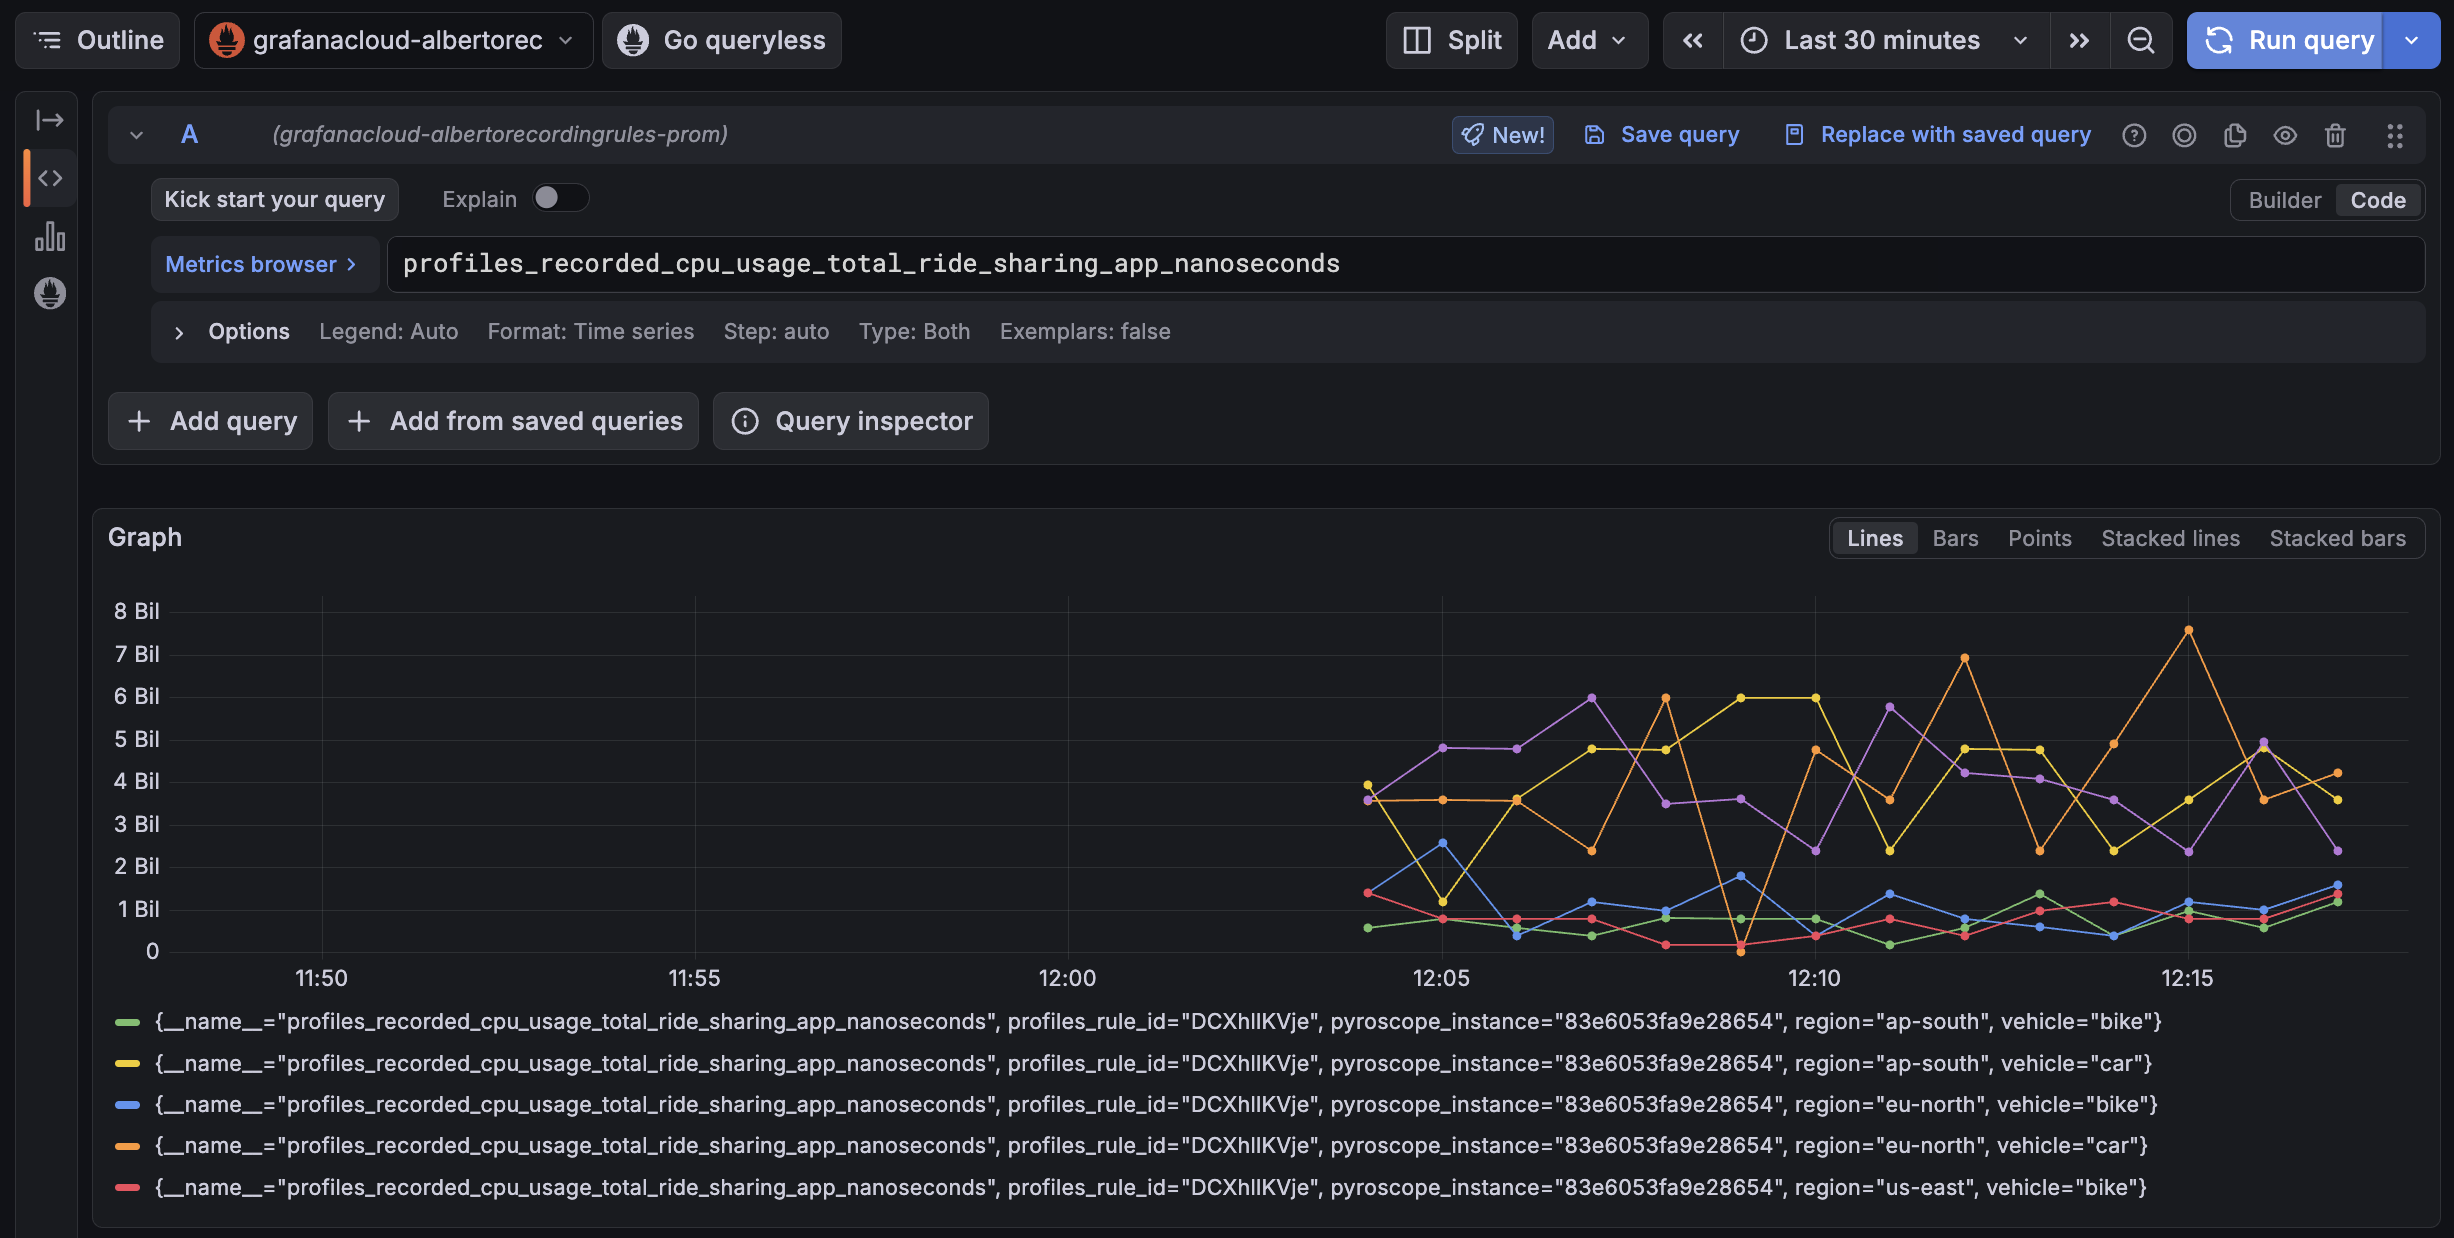
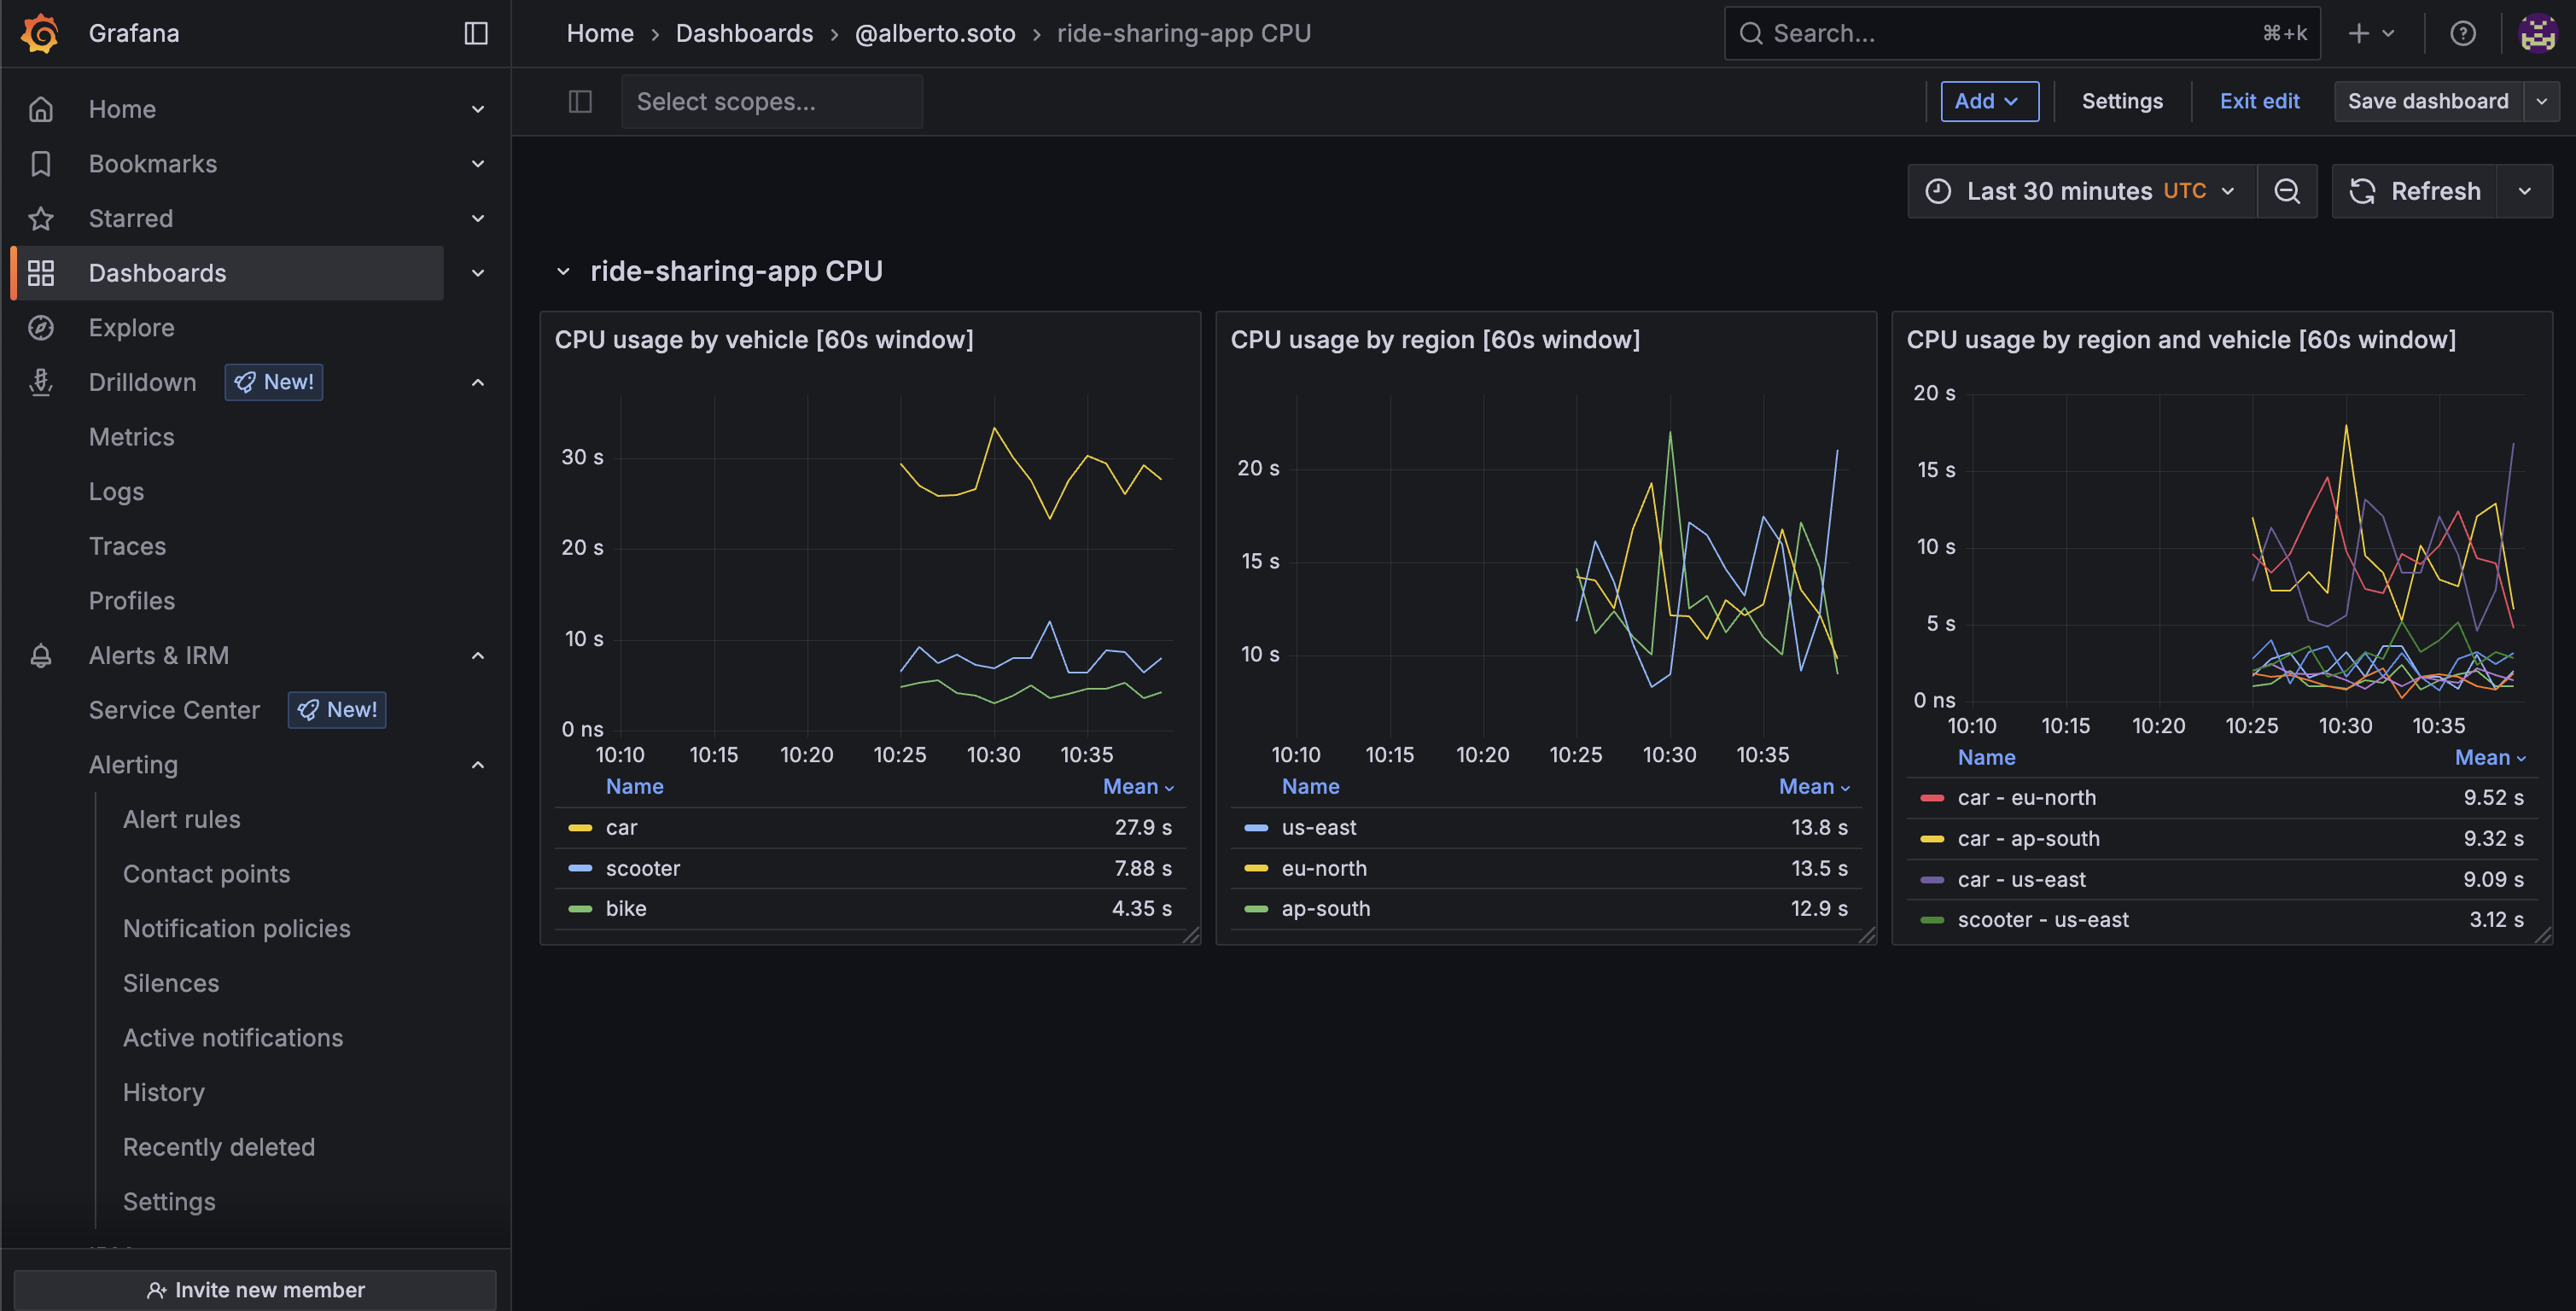
In the following example, you have the advantage of the metrics created by Pyroscope.
The data is enhanced with profiling labels (such as vehicle), which helps highlight where more resources are spent.
At first glance, you can see that the car vehicle is consuming more, although you can’t see any relevant difference between regions:
You can now create alerts from metrics coming from Pyroscope:
- Chose a relevant panel you want to keep track of and click … > Edit
- On the Alert tab, chose New alert rule
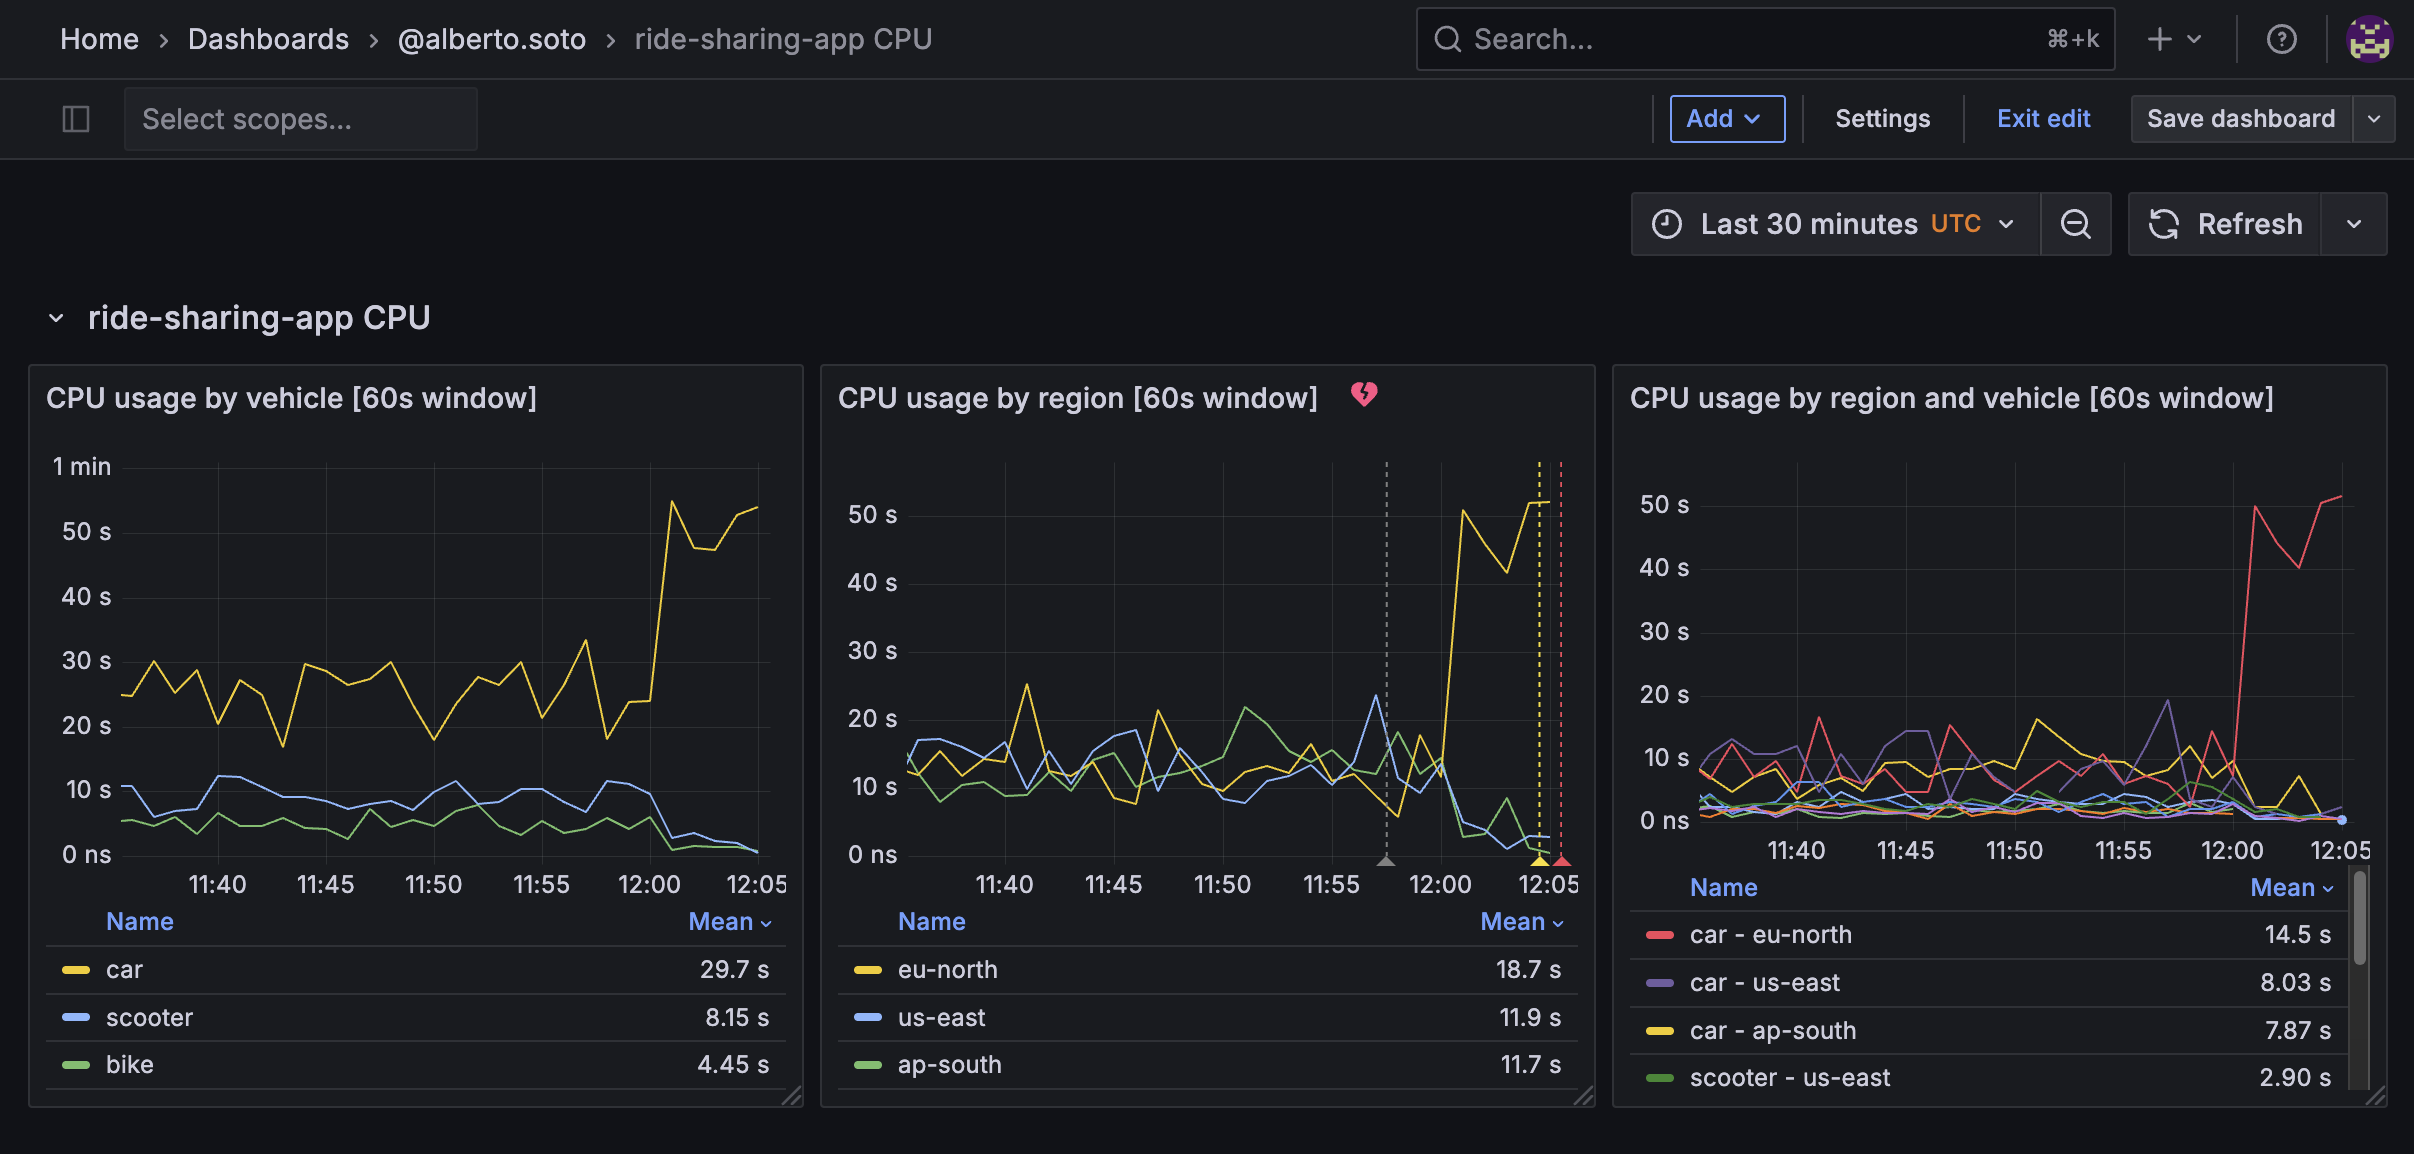
This examples show how a suspicious increase in CPU consumption triggers an alert on eu-north region.
From the dashboard, you can see that it’s also probably related with car.
Example: visualize a function consumption from profiling data
You can use recording rules to target specific functions. This is useful to compare, spot, or monitor particular functions in a whole system. For example, you could see which service in your cluster is spending more on garbage collection, compare specific parts of your code on a new version release, or help find whether some of your codebases are running some CVE-prone vulnerable function.
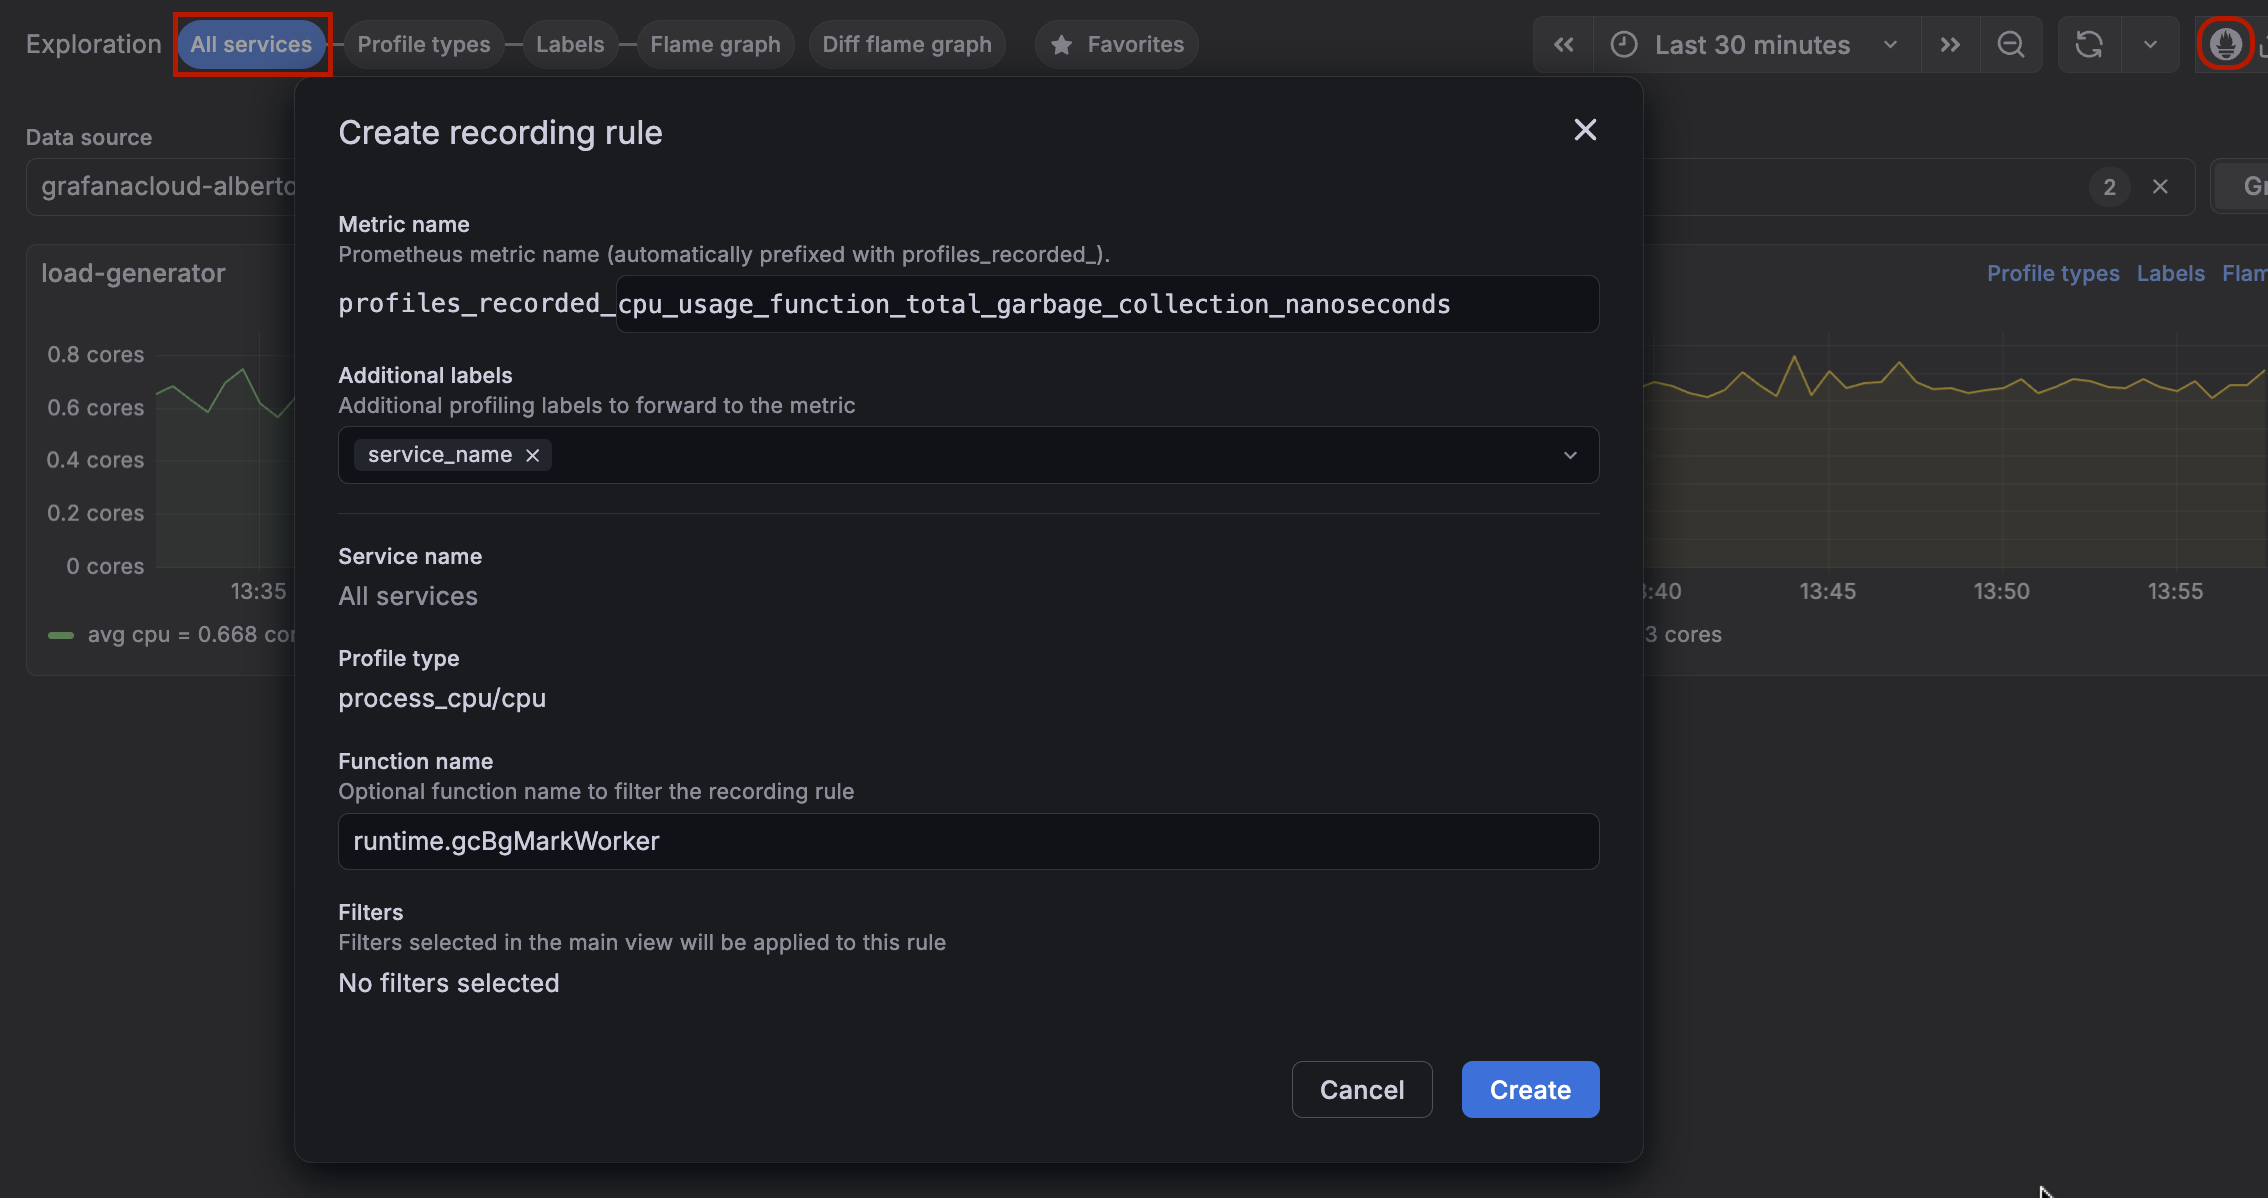
This example shows how to create a recording rule to visualize the percentage of CPU spent on garbage collection, by service:
- In the All services view, click the Prometheus icon on the top right corner menu and choose Add recording rule.
- In the wizard, make sure
service_nameis being exported in the Additional Labels field, and Service is targeting All services. - Add the function name you want to record. If you are not sure about the exact name, you can find this information in the flame graph.
- Press Create.
- Consume the metric in Explore.
If you do the same but omit the step 3, you can compute the total CPU usage by service, so you can compute percentages:


