How Frontend Observability works
Frontend Observability uses the Faro Web SDK, a lightweight, open source JavaScript library that runs in the browser. After you install and configure the SDK, it automatically collects performance metrics, errors, and tracing data. The SDK sends this telemetry to your Grafana data source or OpenTelemetry collector, where it becomes available in dashboards and trace views.
Architecture overview
The Grafana Faro Web SDK powers the fully managed Grafana Cloud Frontend Observability solution for Real User Monitoring (RUM) in Grafana Cloud.
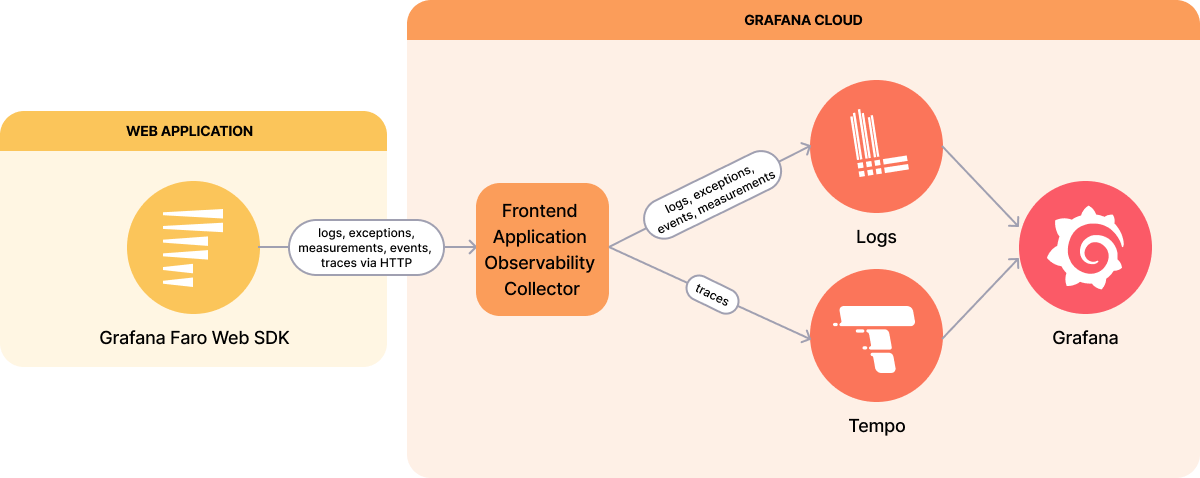
Grafana Faro Web SDK
The Grafana Faro Web SDK is a highly configurable JavaScript library that can be embedded in web applications to collect performance metrics, logs, exceptions, events and traces which are then forwarded to the collector endpoint in Grafana Cloud. In addition to multiple automatic instrumentation capabilities, Faro also offers manual instrumentation capability.
Grafana Cloud Collector Endpoint
Grafana Cloud Collector Endpoint receives data from the Grafana Faro Web SDK, applies processing such as stack trace transformation, and forwards the data to the appropriate logs and traces backends in Grafana Cloud. The collector endpoint applies aggressive rate limiting to prevent abuse or accidental overages. Rate-limited data is currently dropped.
Typical workflow
A typical workflow includes:
- Use the Faro Web SDK to instrument your application
- Configure telemetry collection for errors, logs, and tracing
- Send data to Grafana Cloud or an OpenTelemetry-compatible backend
- Analyze telemetry using dashboards and trace views
- Investigate issues using errors, slow interactions, or degraded metrics
Note
The SDK works with single-page applications (SPAs), multi-page apps, and modern frontend frameworks.


