Geolocation visualizations
The Geolocation tab helps you understand where your users are experiencing performance issues or errors. It shows a visual map and detailed table of your application’s performance metrics broken down by geographic location, from continents down to specific countries, states, provinces, and cities.
Use this feature to:
- Identify regions with poor performance or high error rates.
- Compare Web Vitals metrics across different locations.
- Investigate location-specific issues affecting your users.
- Make data-driven decisions about infrastructure and optimization priorities.
Before you begin
Geolocation must first be enabled in your application settings.
Access the geolocation tab
To access the geolocation tab:
- Open your application in the Frontend Observability interface.
- Click the Geolocation tab in the main navigation.
Enable geolocation tracking
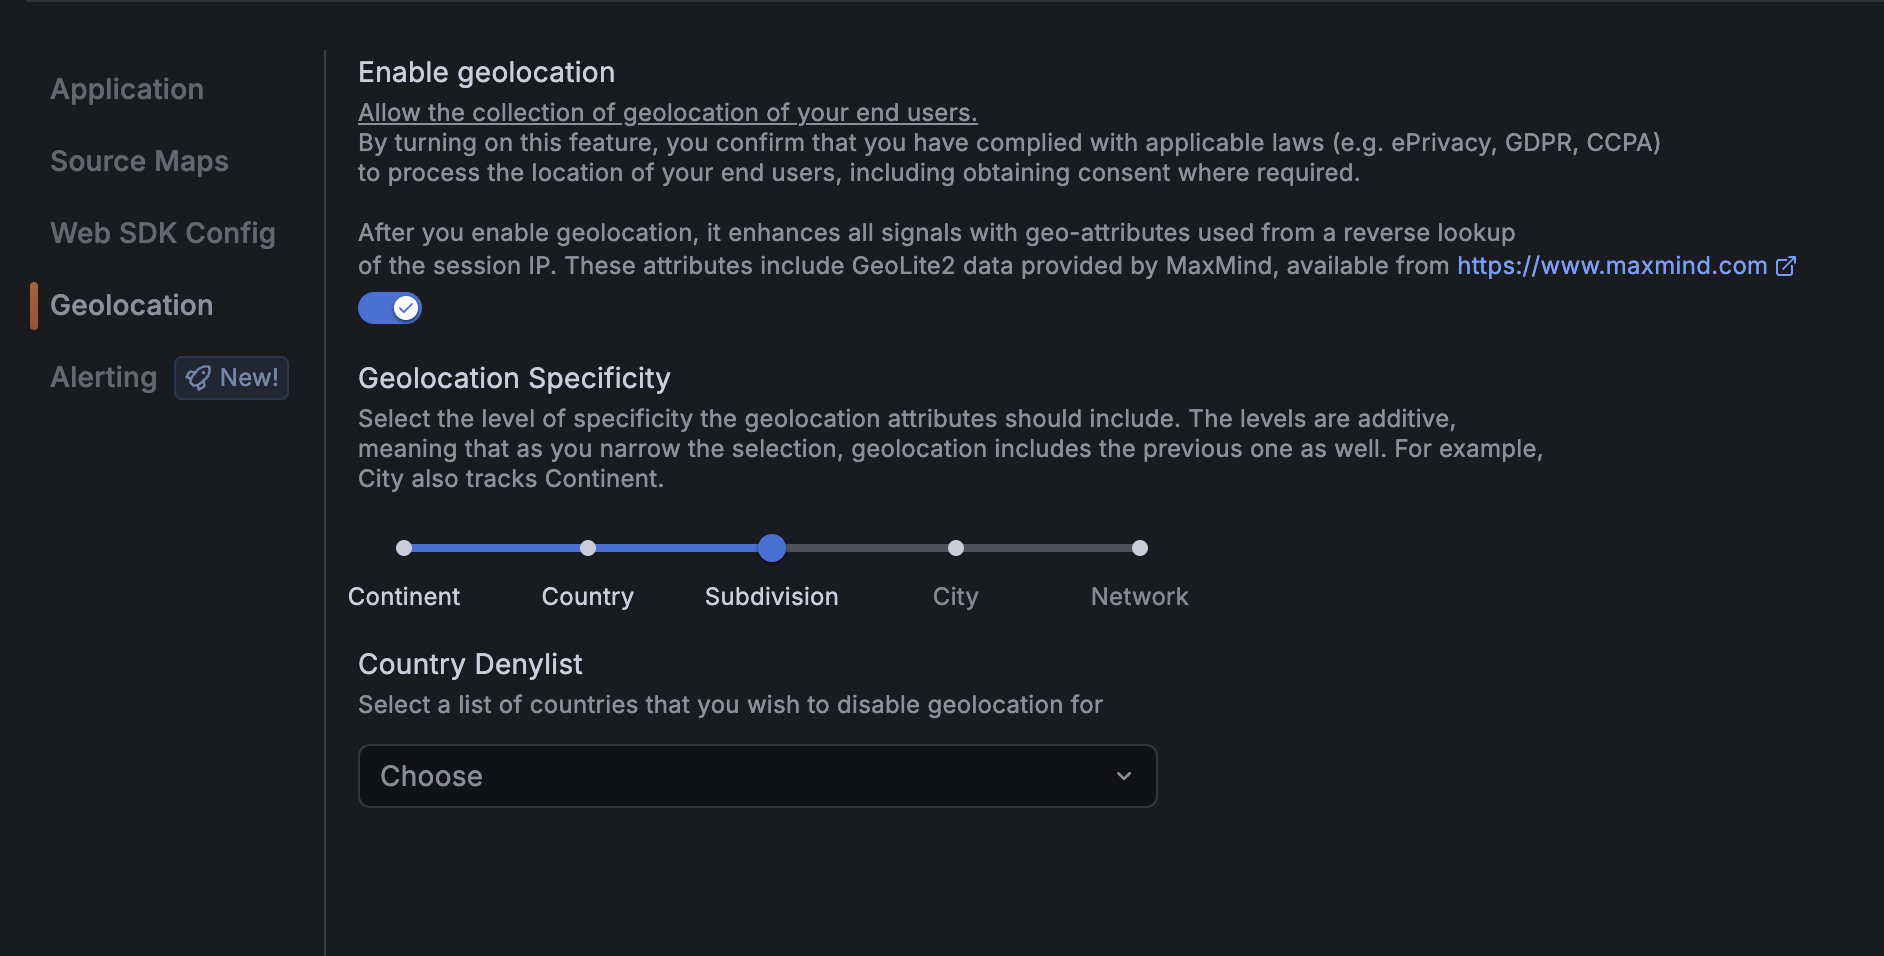
To enable geolocation tracking:
- Use the left navigation to select Frontend and then choose the desired application.
- Click the Settings tab and then click Geolocation.
- Select Enable geolocation.
- Choose the specificity level (how detailed you want the location data):
- Level 0: Continent only
- Level 1: Country
- Level 2: State or province
- Level 3: City
- Level 4: ISP or network (ASN)
- (Optional) Add countries to the deny-list to exclude them from tracking.
Note
It may take some time for data to appear after first enabling the feature. Geographic data is collected from real user sessions.
Geolocation interface
When you open the Geolocation tab, you see two main sections:
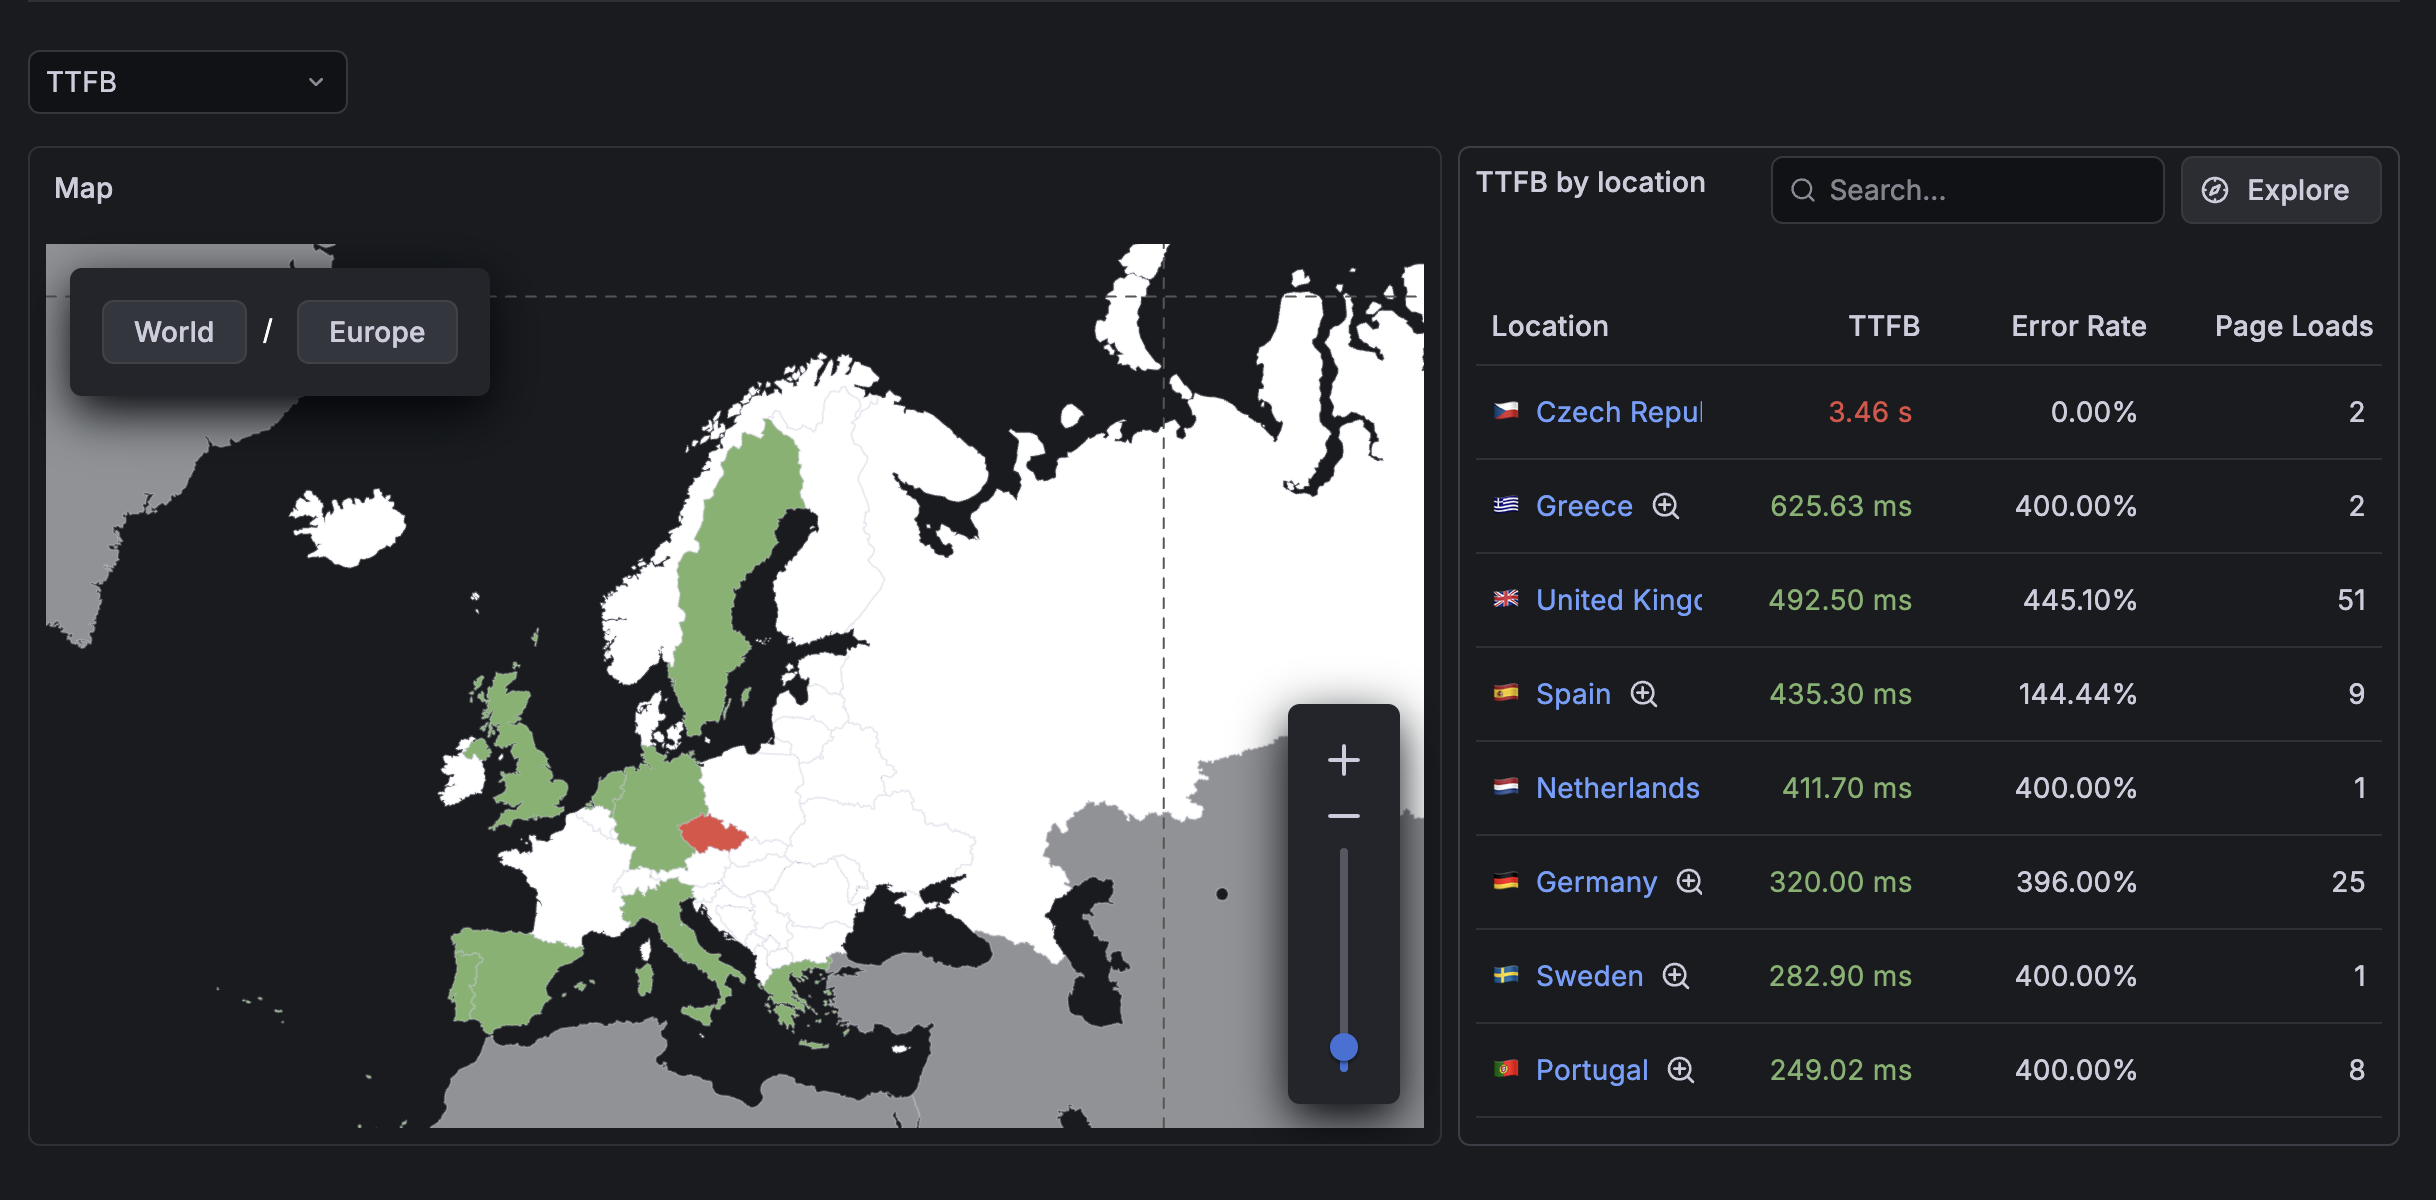
Interactive map
The world map displays your selected metric using color coding:
- Green: Good performance (meeting targets).
- Orange: Needs improvement (near threshold).
- Red: Poor performance (exceeding threshold).
- Gray: No data available for this region.
The intensity of the color indicates the severity - darker colors mean worse performance.
Data table
The table shows detailed metrics for each geographic location at your current zoom level. Each row includes:
- Location name (with country flag for countries).
- Metric values for the selected KPI.
- Navigation icons to drill deeper or view related data.
KPI selector
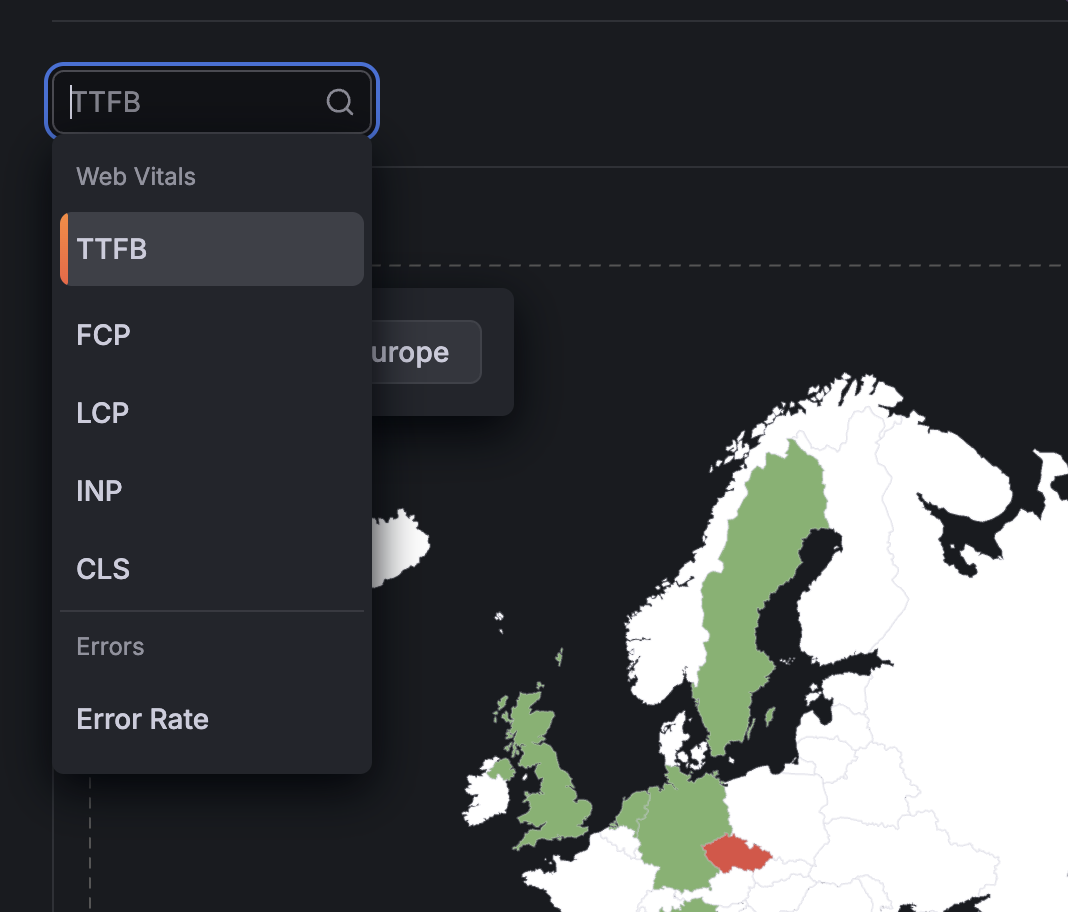
Use the dropdown menu to switch between different performance metrics:
- TTFB (Time to First Byte): Server response time.
- FCP (First Contentful Paint): When first content appears.
- LCP (Largest Contentful Paint): When main content loads.
- INP (Interaction to Next Paint): Responsiveness to user input.
- CLS (Cumulative Layout Shift): Visual stability.
- Error Rate: Percentage of sessions with errors.
All Web Vitals metrics show the 75th percentile value, which represents the experience of your typical users.
Explore the geolocation tab
The following sections describe how to interact with the geolocation map and data table.
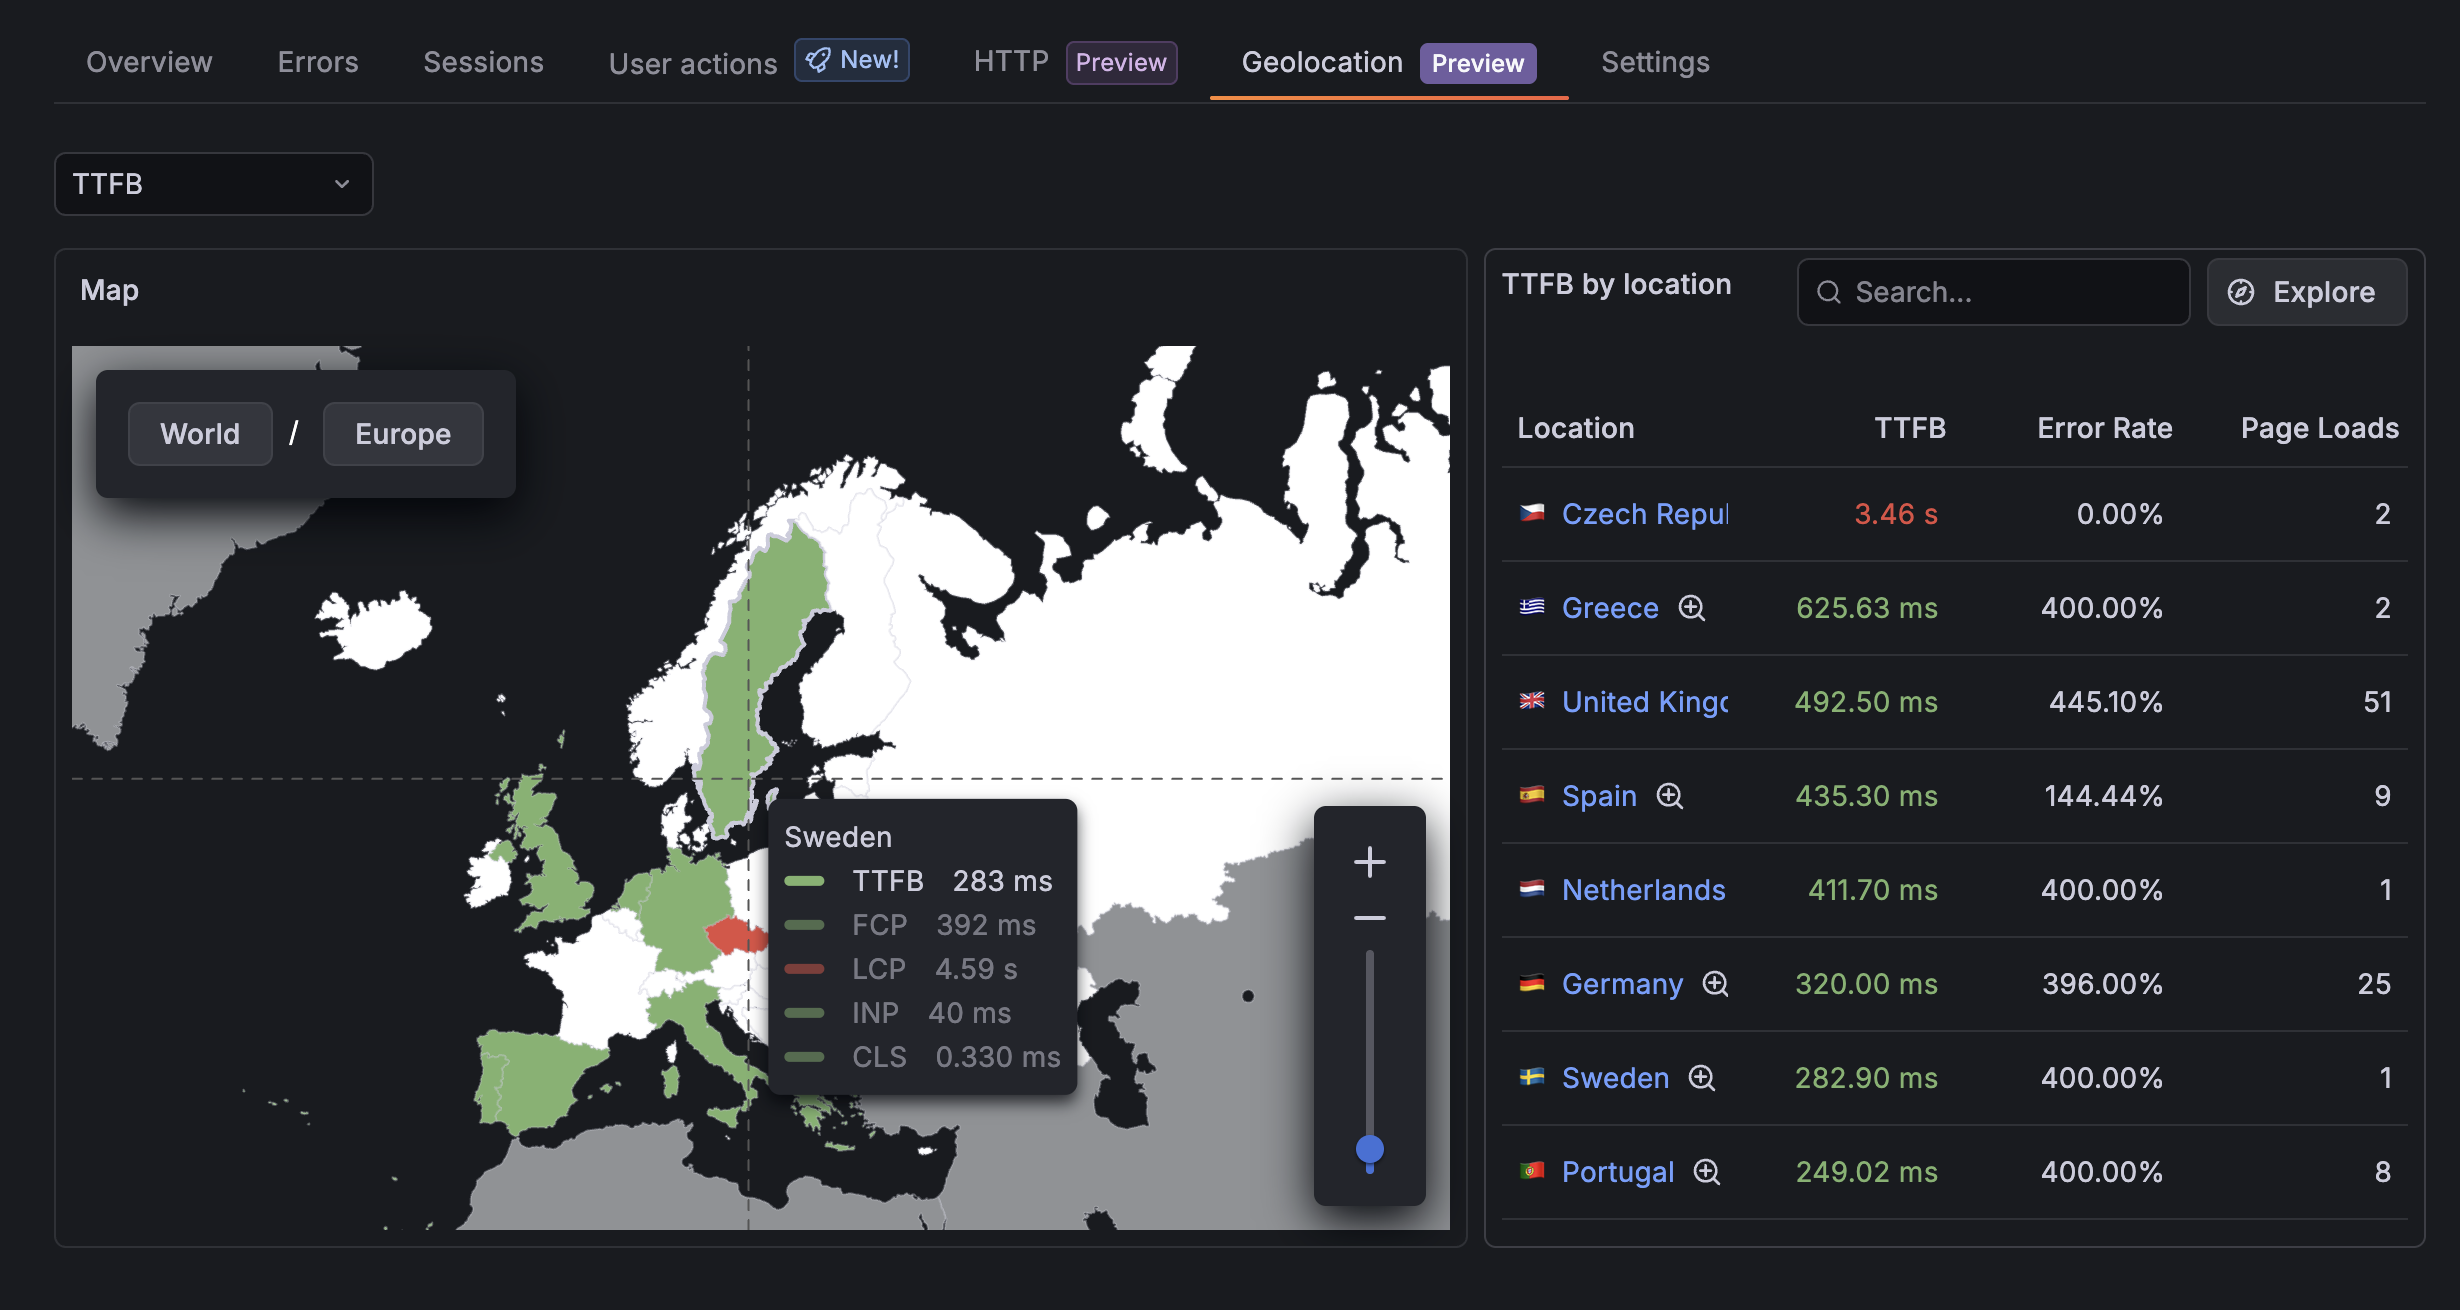
Explore the map
Hover over a region
- Move your mouse over any colored region to see a tooltip.
- The tooltip displays the location name and metric value.
- This gives you a quick overview without changing your view.
Click a region
- Click once to “pin” the tooltip so it stays visible.
- Click on a different metric to change the selected KPI.
- This is useful when you want to compare values or take notes.
- Click elsewhere or click the region again to unpin.
Double-click to drill down
- Double-click any region to zoom into that location.
- For example, double-click North America to see individual countries.
- Then double-click the United States to see states.
- Continue drilling down to cities if that level is enabled.
Use breadcrumb navigation
- At the top of the map, you see breadcrumbs showing your current location path.
- Example: “World > North America > United States > California”
- Click any breadcrumb to quickly jump back to that level.
- Click World to return to the continent view.
Use zoom controls
- Use the + and - buttons to zoom in and out.
- Or use the slider on the left side of the map.
- This changes the map zoom without drilling into specific regions.
Use the data table
View detailed metrics
- The table shows all locations at your current geographic level.
- Scroll through the table to see all available data.
- Sort columns by clicking the column headers.
Navigate to details
- Click the magnifying glass icon to drill into that location on the map.
- Click the arrow icon to view errors or overview page for that specific location.
- Geographic filters are automatically applied when you navigate.
Compare locations
- Use the table to quickly compare metrics across different regions.
- Identify outliers or patterns in your data.
Switch metrics
- Click the KPI dropdown at the top of the page.
- Select the metric you want to analyze.
- Both the map and table update to show the new metric.
- Color coding adjusts based on the thresholds for that metric.
Common workflows
Investigate performance issues
- Start with the Error Rate metric to see where errors are concentrated.
- Double-click regions with high error rates to drill down.
- Use the table to identify specific cities or areas.
- Click through to the Errors page to see detailed error information.
Optimize Web Vitals
- Select a Web Vital metric like LCP (Largest Contentful Paint).
- Look for red or orange regions indicating poor performance.
- Drill down to identify if issues are country-wide or in specific areas.
- Use this information to prioritize CDN placement or optimization efforts.
Monitor multiple metrics
- Start with LCP to check loading performance.
- Switch to INP to check interactivity.
- Switch to CLS to check visual stability.
- Build a complete picture of user experience by location.
Geographic levels
The Geolocation tab organizes data in a hierarchy:
- Continent (world view): Africa, Asia, Europe, North America, South America, Oceania, Antarctica.
- Country: Individual countries within each continent.
- Subdivision: States, provinces, or regions within countries.
- City: Specific cities within subdivisions.
- ASN: Internet service providers or networks (if enabled).
Not all levels may be available depending on:
- Your administrator’s specificity level settings.
- Data availability for certain regions.
- Privacy restrictions for your organization.
Error rate
- Percentage of sessions that experienced at least one error.
- Lower is better.
- High error rates in specific regions may indicate localization issues, network problems, or regional infrastructure issues.
Page loads
- Total number of page loads from that location.
- Helps you understand traffic distribution.
- Larger numbers mean more users from that region.
Privacy and data collection
The following sections describe how geographic data is collected and how privacy is protected.
Data source
Geographic data is collected using MaxMind GeoLite2, which provides:
- Accurate location detection based on IP addresses.
- Privacy-respecting data collection.
- Regular updates for accuracy.
Privacy control
Country deny-list
- Administrators can exclude specific countries from geolocation tracking.
- Useful for GDPR, CCPA, or other regulatory compliance.
- Users from deny-listed countries don’t appear in the data.
Specificity levels
- Limiting specificity levels reduces data granularity.
- More privacy-friendly for sensitive applications.
- Some organizations may have restrictions on city-level tracking.
Compliance
The Geolocation feature includes:
- Configurable data collection levels.
- Ability to exclude regions entirely.
- No personally identifiable information (PII) collected.
Troubleshooting
The following sections describe common issues and their solutions.
A region shows gray (no data)
Possible causes
- No users from that region have visited during the selected time period.
- The region is in your country deny-list.
- Data collection failed for that region.
Solutions
- Check your time range filter - expand it to see more data.
- Verify the country isn’t in your deny-list.
- Confirm users are actually visiting from that region.
City-level data unavailable
Possible causes
- The specificity level is set too low.
- City-level data isn’t available for that country.
- Privacy restrictions prevent city-level tracking for your organization.
Solutions
- Increase the specificity level in Application Settings.
- Some countries may not have subdivision/city data available.
- Check if your organization has policies limiting data granularity.
Performance is slow when zooming
Possible causes
- Large amounts of data at granular levels.
- Browser performance limitations.
- Network latency loading map data.
Solutions
- Use a modern browser with good performance.
- Clear browser cache and reload.
- Consider reducing specificity level to improve performance.
Tips and best practices
The following sections provide recommendations for using geolocation data effectively.
Get the most value
- Start broad, then drill down: Begin at the continent level to identify problem regions, then drill into specifics.
- Compare multiple metrics: Don’t just look at one metric - check all Web Vitals and error rates.
- Use with time filters: Combine geographic filtering with time range filters to track improvements.
- Monitor regularly: Check the Geolocation tab weekly to spot new trends or issues.
- Share with your team: Use the data to inform infrastructure and optimization decisions.
Common use cases
CDN optimization
- Identify regions with poor TTFB or LCP.
- Use data to justify adding CDN edge locations.
- Monitor improvements after CDN changes.
Regional rollouts
- Check error rates before and after deploying to new regions.
- Identify localization issues quickly.
- Monitor performance as you expand to new markets.
Infrastructure planning
- Understand where your users are located.
- Plan server capacity based on geographic distribution.
- Identify regions that might need dedicated infrastructure.
Performance budgets
- Set different performance targets by region.
- Account for infrastructure differences.
- Track regional performance against goals.
Settings reference
The following sections describe the available geolocation settings and configuration options.
Geolocation settings location
To access geolocation settings:
- Navigate to Application Settings.
- Find the Geolocation section.
Available settings
Enable geolocation tracking
- Toggle on/off.
- When disabled, no geographic data is collected.
- Turning this off clears the Geolocation tab.
Specificity level
- Range: 0 (continent) to 4 (ASN or network).
- Level 0: Continent only.
- Level 1: Add countries.
- Level 2: Add states or provinces.
- Level 3: Add cities.
- Level 4: Add ISP or network data.
- Higher levels provide more detail but collect more data.
Country deny-list
- Multi-select list of countries.
- Use two-letter country codes (for example, US, GB, DE).
- Deny-listed countries don’t appear in any geographic data.
- Use for compliance with regional regulations.
Privacy recommendations
- Start with lower specificity levels (0-1) and increase only if needed.
- Use the country deny-list for regions with strict privacy laws.
- Document your geolocation data collection in your privacy policy.
- Review settings quarterly to ensure they match your privacy requirements.
FAQ
Q: How accurate is the geographic data? A: Geographic data is based on IP addresses using MaxMind GeoLite2, which is generally accurate at the country level (95%+) and reasonably accurate at the city level (70-80%). Precision varies by region.
Q: Can users opt out of geographic tracking? A: Geographic data is collected automatically as part of application monitoring. This can be disabled on a per-user basis using the specific configuration in the SDK.
Q: Does this track individual users? A: No. The Geolocation tab shows aggregated metrics by region. No personally identifiable information is collected or displayed.
Q: How often does the data update? A: Data updates in real-time as users interact with your application. Depending on traffic levels, you may see changes within minutes.
Q: Why do some countries have subdivision data and others don’t? A: Subdivision (state/province) data availability varies by country based on the geographic data sources. Major countries like the US, Canada, and major European countries have subdivision data, while smaller countries may only have country-level data.
Q: What happens if I change the specificity level? A: Previously collected data at higher levels is retained, but new data is only collected at the new specificity level. To see more detailed data, you need to wait for new sessions to be collected.
Q: How much data do I need before the Geolocation tab is useful? A: You need at least a few hundred sessions spread across different regions for meaningful insights. Applications with higher traffic see more detailed and reliable geographic patterns.


