
Introduction to Grafana Assistant
Grafana Assistant brings natural-language intelligence to Grafana Cloud. You can explore telemetry, build dashboards, and launch investigations without memorizing syntax. Every action passes through existing security, auditing, and RBAC layers, and respects your permissions.
This article explains how Assistant works. You’ll learn to write effective prompts, query data sources, launch investigations, and provide feedback.
Grafana Labs processes Assistant conversations using third-party AI providers while keeping your data secure. Conversation content is not used to train external models, and all requests flow through Grafana Cloud’s standard security controls. For complete details about data handling, encryption, and access controls, refer to Privacy and security.
Write effective prompts
Assistant responds best to clear, action-oriented prompts. Follow these practices to get better results:
- Start prompts with action verbs like Create, Explain, or List.
- Add timeframe and scope after the verb.
- Use
@to mention specific data sources, dashboards, or panels. - Break complex requests into smaller prompts.
- Start a new conversation when you switch topics.
Configure quickstart prompts
Quickstart prompts let you trigger common prompts with one click. You can save your own quickstarts. Your Grafana administrator can publish team quickstarts in Assistant settings.
To configure quickstart prompts:
- Navigate to Grafana Assistant > Settings > Quickstart prompts.
- Click Create Quickstart Prompt.
- Set Scope to Just me or Everybody.
- Add a Title and enter the Prompt.
- Leave Enabled on to show the prompt in chat.
- Click Create.
To manage quickstarts, click Edit or Delete, or toggle Enabled on each quickstart card.
Learn and onboard
Use Assistant to learn Grafana features, concepts, and best practices. You can ask for step-by-step instructions, clarify observability concepts, or request monitoring strategies for new services. For more information, refer to Get onboarding support.
Query data
Assistant queries your data sources including Prometheus, Loki, Tempo, and SQL databases. It helps you write, explain, and optimize queries in PromQL, LogQL, TraceQL, and SQL. You can draft queries, refine them, and visualize results directly in chat. For more information, refer to Query data.
Manage dashboards
Find, understand, create, and edit dashboards. Assistant can explain visualizations, scaffold new dashboards based on your goals, and help you modify panels and queries. For more information, refer to Manage dashboards.
Navigate resources
Locate dashboards, data sources, and metrics without browsing folders manually. You can search by content or tags, discover available data sources, and launch Explore views with pre-loaded queries. For more information, refer to Navigate Grafana resources.
Launch investigations
Note
Grafana Assistant Investigations is currently in public preview. Grafana Labs offers limited support, and breaking changes might occur prior to the feature being made generally available.
Answer quick questions about your telemetry or launch multi-agent investigations. By scanning Prometheus data sources, you can build infrastructure memory that gives Assistant context about your services. Use investigation mode for complex incidents to analyze multiple data sources and generate structured reports. For more information, refer to Run investigations.
Collaborate with your team
Share findings using Copy on any response to move summaries into incident channels or tickets. Ask Assistant for audience-specific updates, for example, “Summarize these findings for the incident channel”.
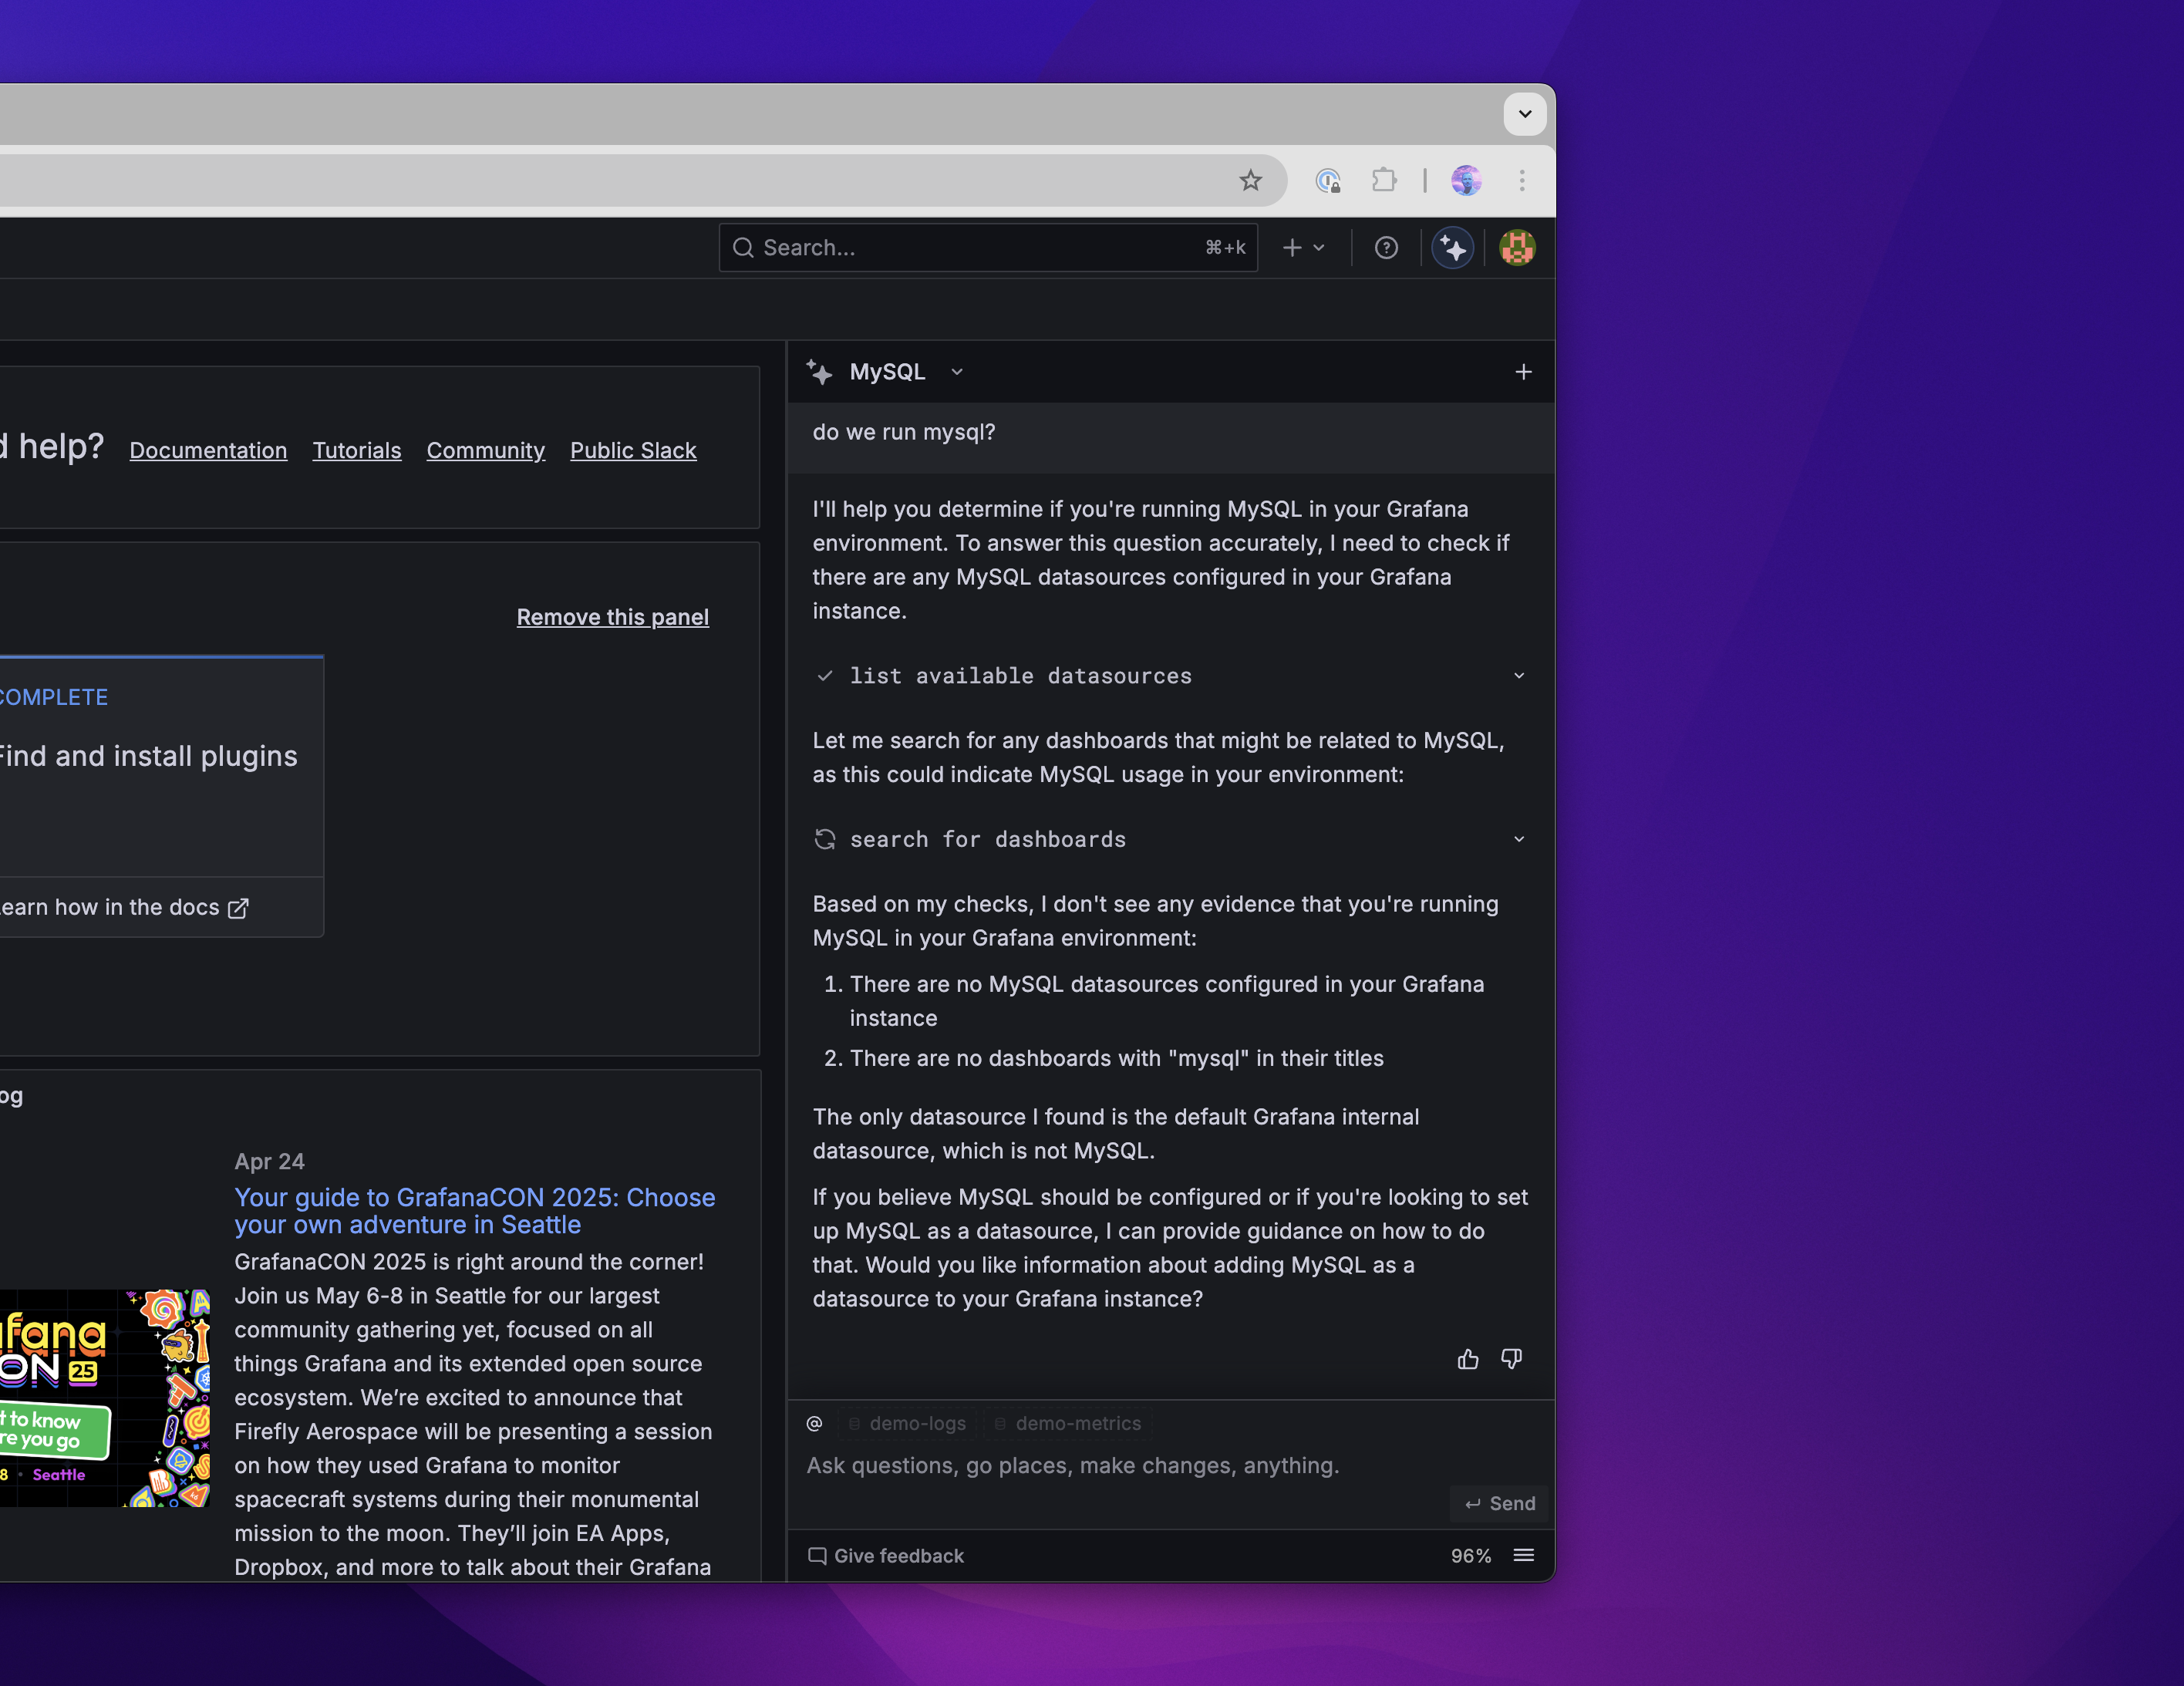
Provide feedback
Provide feedback using the thumbs-up or thumbs-down so Grafana Labs can improve responses. Add a short note explaining what worked or what went wrong. Grafana Cloud stores feedback securely. Engineers review it to refine prompts and tune query handlers.


