Saturation with a severity level of critical when utilization exceeds 90%
Failure alerts
Alert
Description
MongodbDown
Fires when Mongo DB is down
MongodbReplicaMemberUnhealthy
Fires when a replica in a replication set is unhealthy
MongodbReplicationLag
Fires when the replication lag of a secondary is more than a configured time duration. Severity is set to warning when lag > 60s and critical when lag > 240s.
MongodbReplicationHeadroom
Fires when the replication lag of a secondary is more than a configured time duration. Severity is set to warning when lag > 60s and critical when lag > 240s.
MongodbTooManyCursorsOpen
Fires when the number of open cursors is above a given threshold. By default, the threshold is set to 10000. Severity is set to warning.
MongodbTooManyCursorTimeouts
Fires if the rate of cursor timeout is above a certain threshold. By default, the threshold is set to 100. Severity is set to warning.
MongodbInternalErrors
Fires when the count of internal errors keeps growing for 5m. Severity is set to warning.
MongodbUserErrors
Fires when the count of user errors keeps growing for 5m. Severity is set to warning.
ReadRequestsQueueingUp
If the read queue keeps growing for 5m. Severity is set to warning.
WriteRequestsQueueingUp
If the write queue keeps growing for 5m. Severity is set to warning.
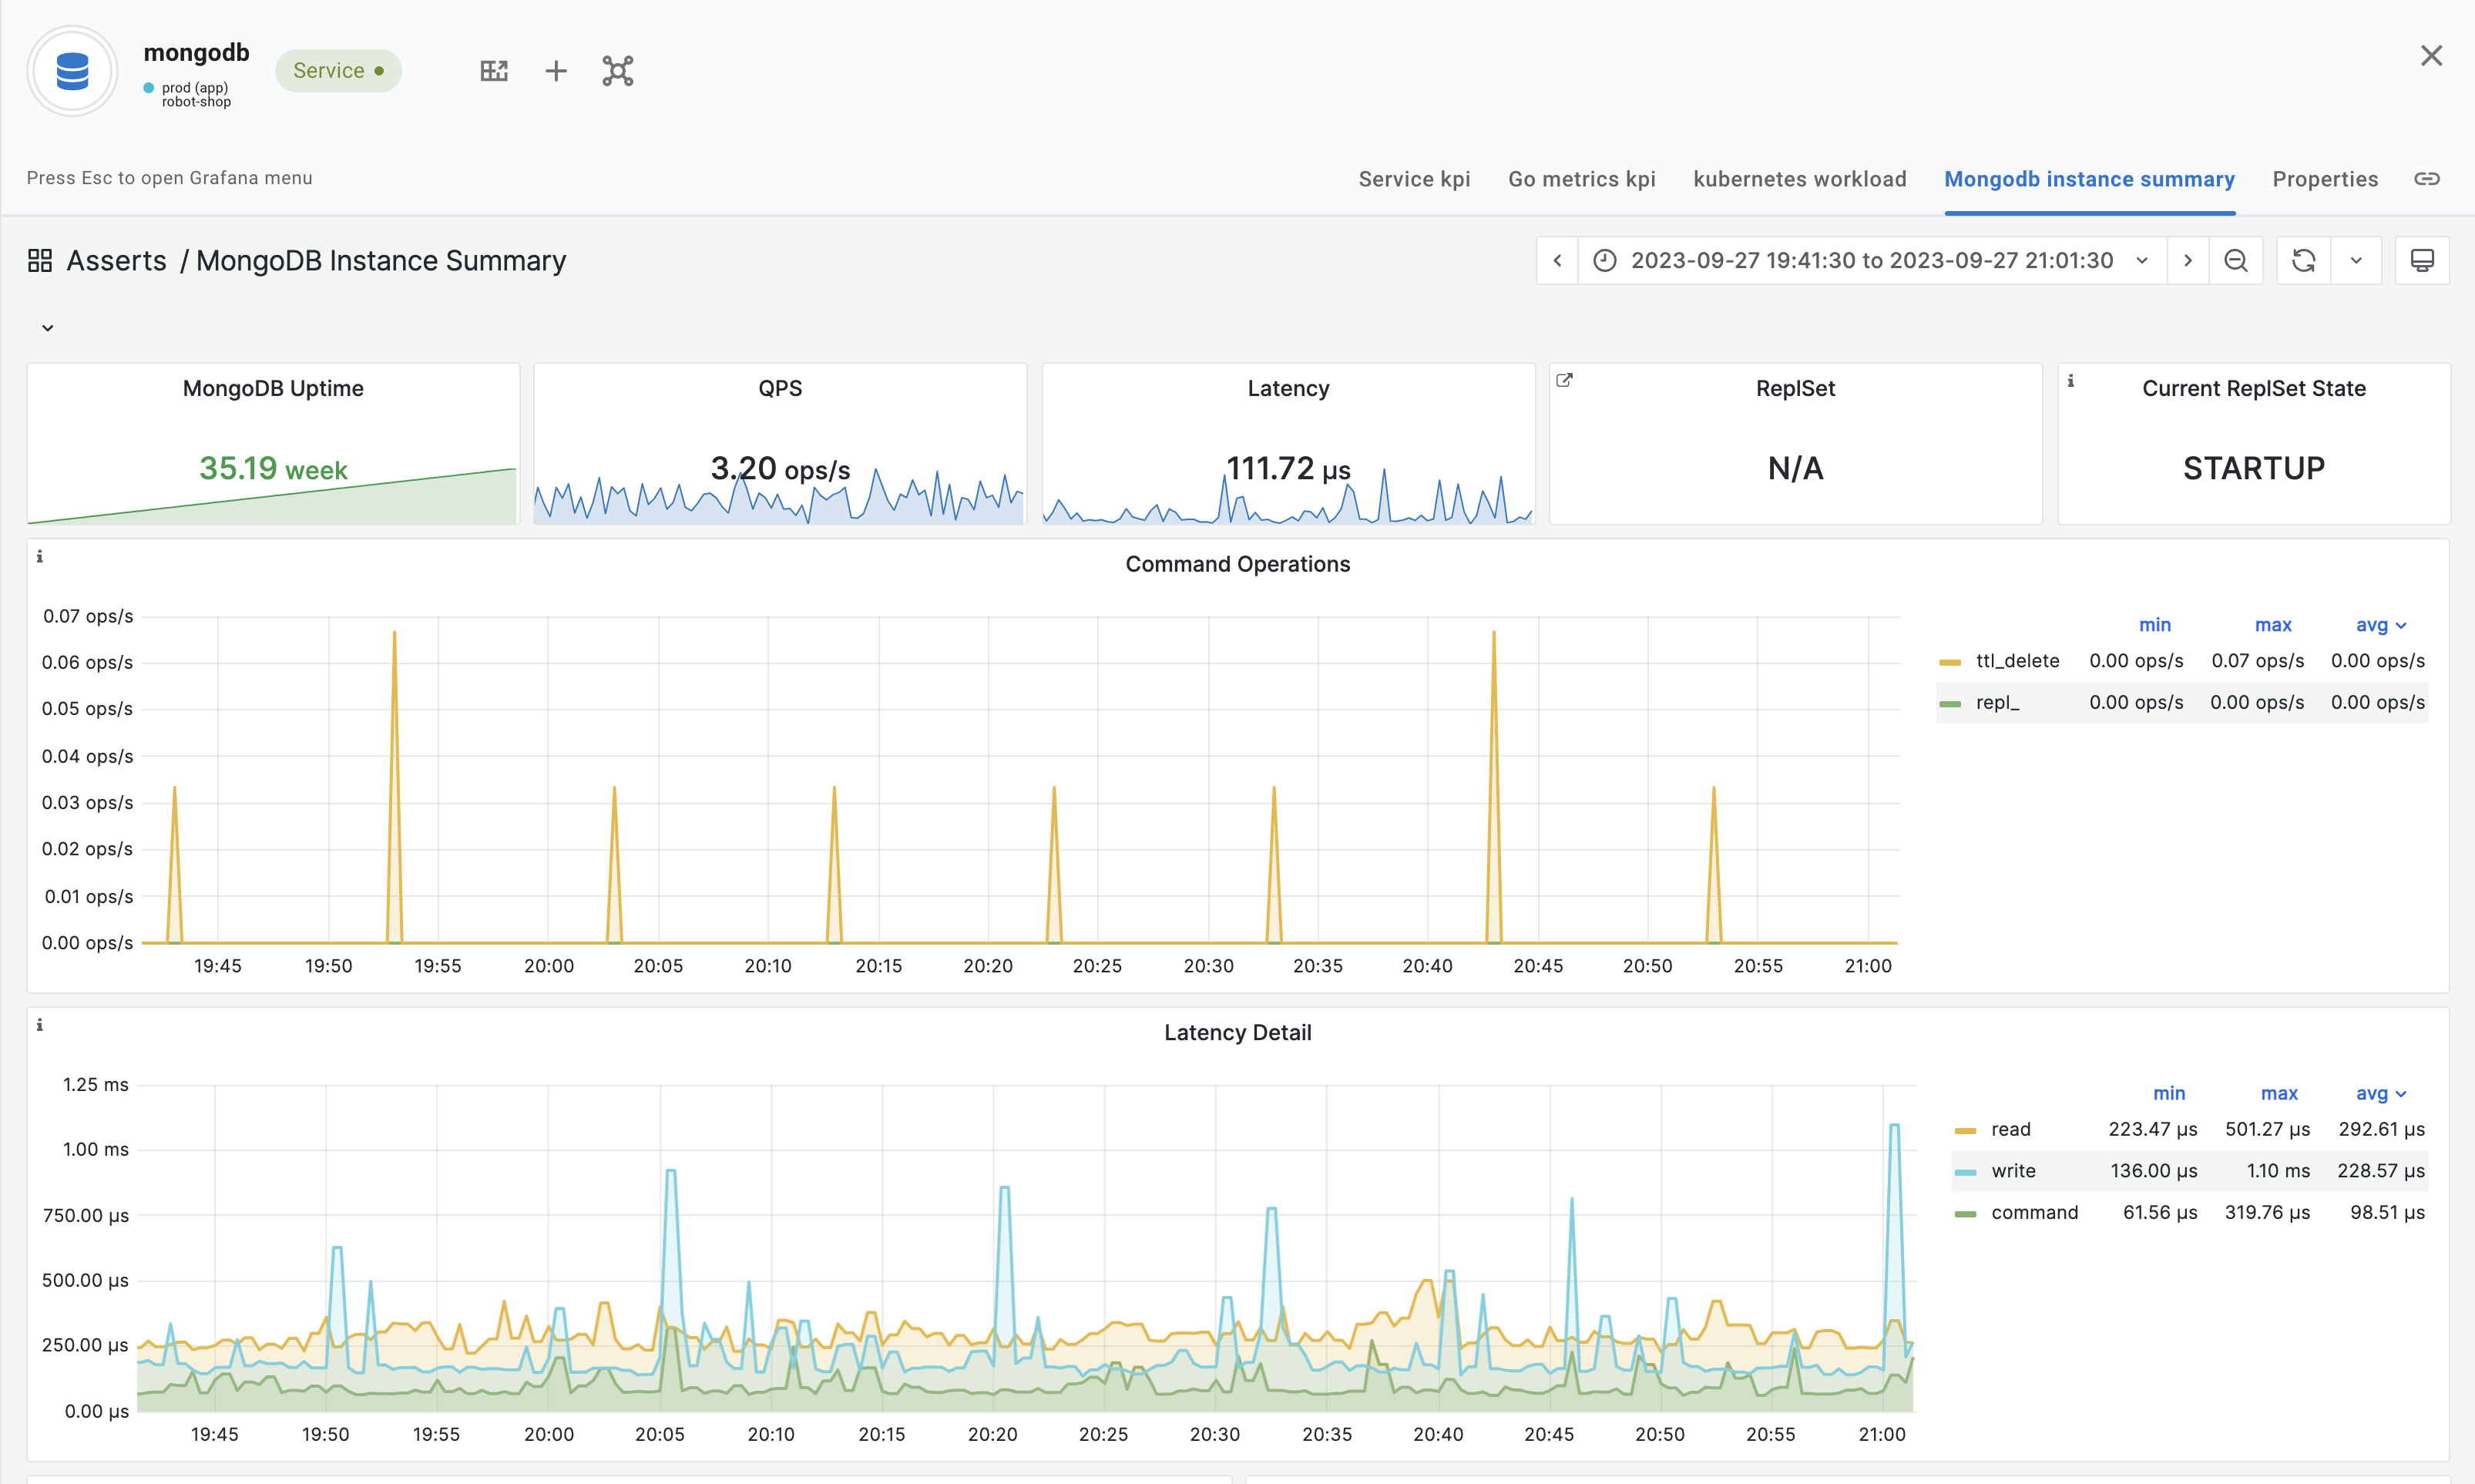
Dashboard
The following image shows an example of the MongoDB Instance Summary Dashboard.

 Grafana Cloud