Set up with Instrumentation Hub
Note
Instrumentation Hub is in public preview.
Instrumentation Hub is an initial setup and configuration tool within Grafana Cloud. With Instrumentation Hub, you can:
- Have all your application and infrastructure services discovered
- View what is discovered
- Control the data you want to gather and what you want to instrument
- View the status of the zero-code instrumentation process
Note
Currently, Instrumentation Hub supports Kubernetes Linux environments.
Access Instrumentation Hub
To access the Instrumentation Hub:
On the main menu, expand the Connections menu and then the Collector menu.
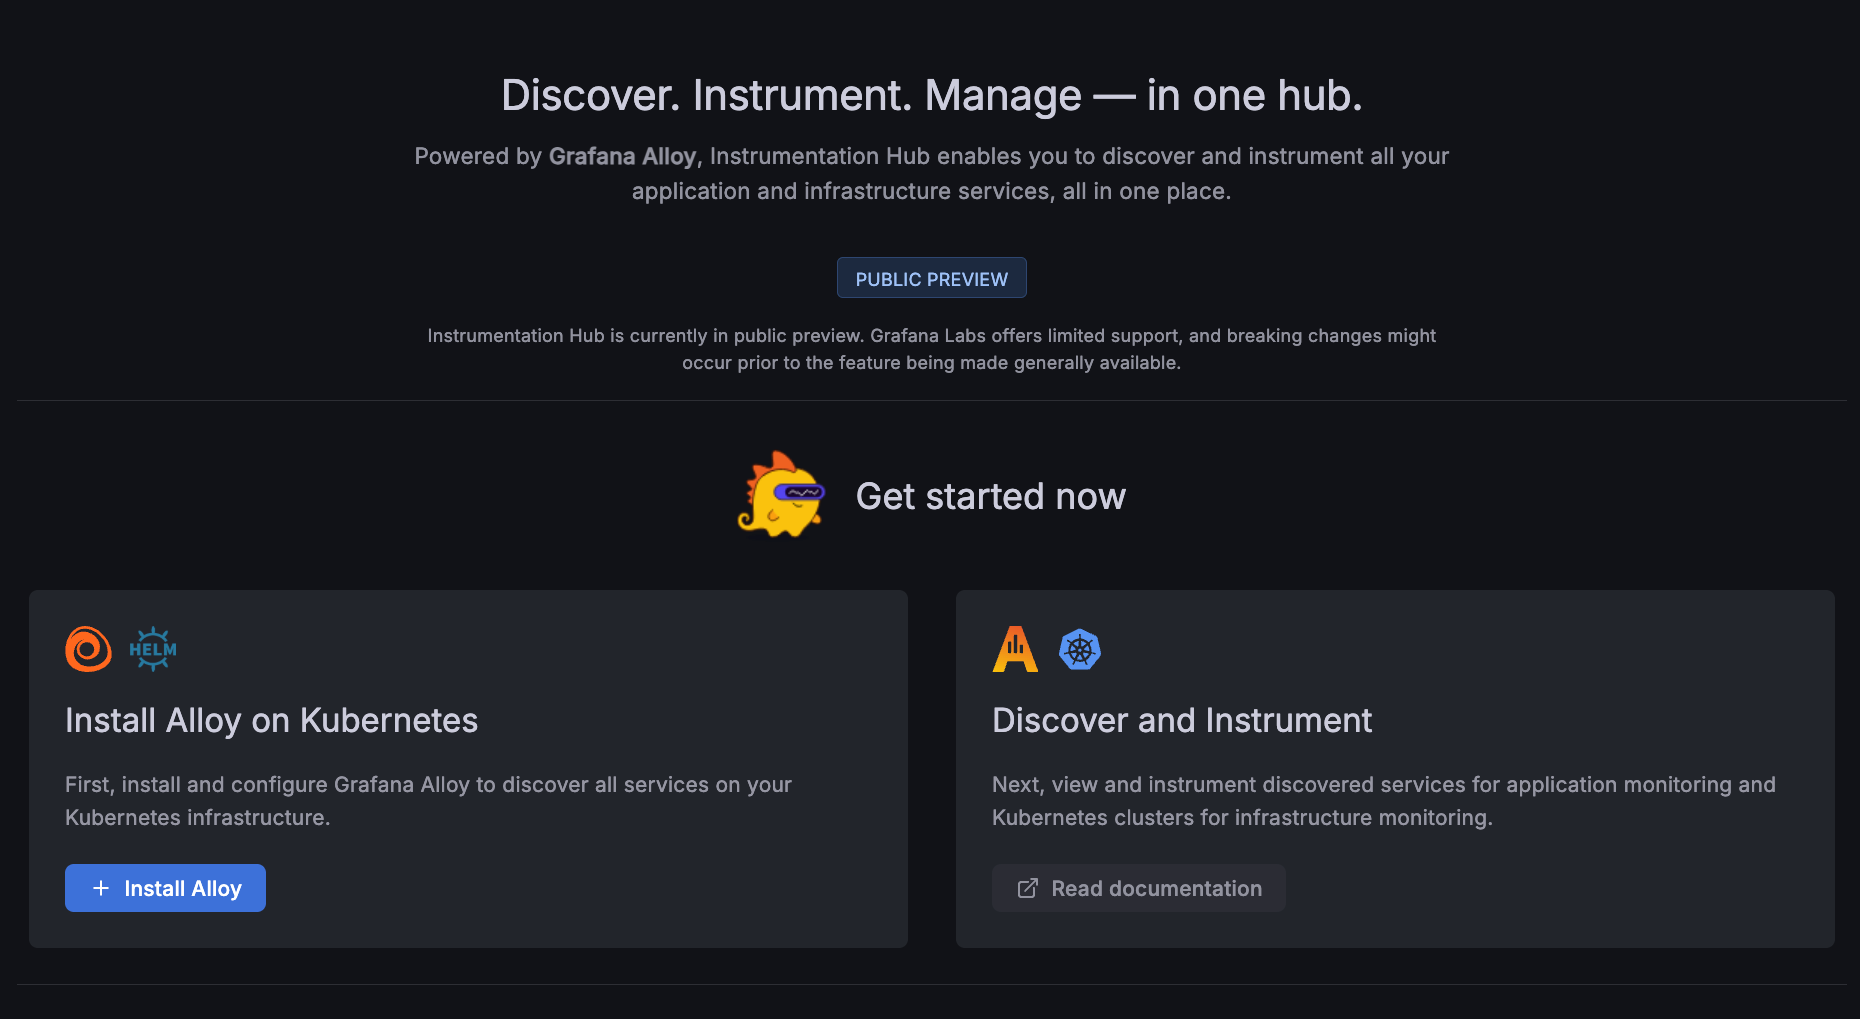
Click Instrumentation Hub to view the get started installation page.
![Initial installation page for beginning Alloy installation Initial installation page for beginning Alloy installation]()
Initial installation page for beginning Alloy installation
The next steps for setup and configuration are to:
- Install the Helm chart to install the Grafana Alloy collector, which installs Beyla to discover all your Clusters and services and instrument your code.
- Choose what to have instrumented using zero-instrumentation.
- Activate application monitoring or Kubernetes Monitoring.
- Build the Knowledge Graph, which creates a correlated view of your data.
Install Grafana Alloy
Click Install Alloy, and complete the following settings.
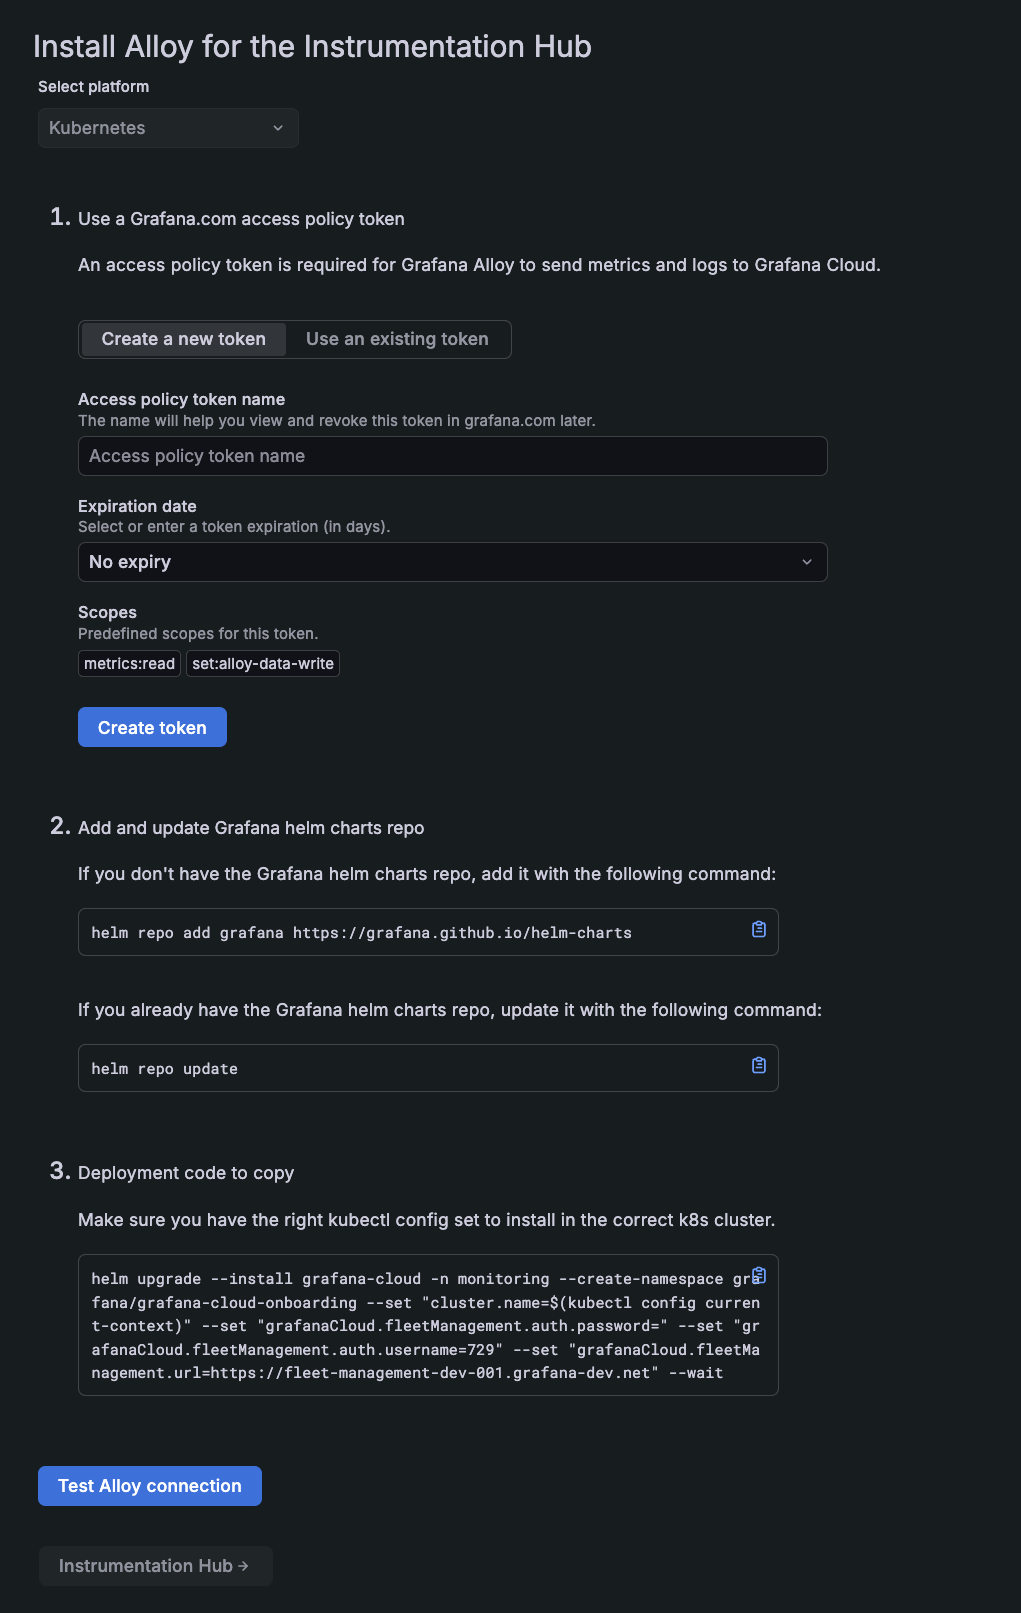
Select platform: Notice Kubernetes is already selected. This is the only platform that Instrument Hub currently works with.
Access token: Either create or use an API token.
Note
You will likely not be using an existing token.
To create a new token:
Click Create a new token.
In the box for Access Policy Token name, enter the name of your token.
In the Expiration date box, select an option for the expiration date.
Click Create token.
The token generates and appears in the token box.
To use an existing token:
Click Use an existing token.
Paste the token into the Access policy token name box.
Note
The existing token must have the ability to publish metrics, logs, traces, and profiles.
Helm charts repository: You need this repository for installation. Copy and paste the code provided into your terminal to either add the repository or update it.
To install and run Grafana Alloy, copy and paste the installation commands provided.
Click Test Alloy connection to ensure the collector is running.
If you receive an error message, verify the output of the Helm command you ran on the previous step. If it was completed successfully, verify that Alloy is listed in the Fleet Management interface. If it’s not listed, verify it has been installed in the target cluster’s
monitoringnamespace by runningkubectl --namespace monitoring get daemonset.Click Instrumentation Hub to open the Instrumentation Hub.
![Instrumentation Hub main page Instrumentation Hub main page]()
Instrumentation Hub main page
Begin instrumentation
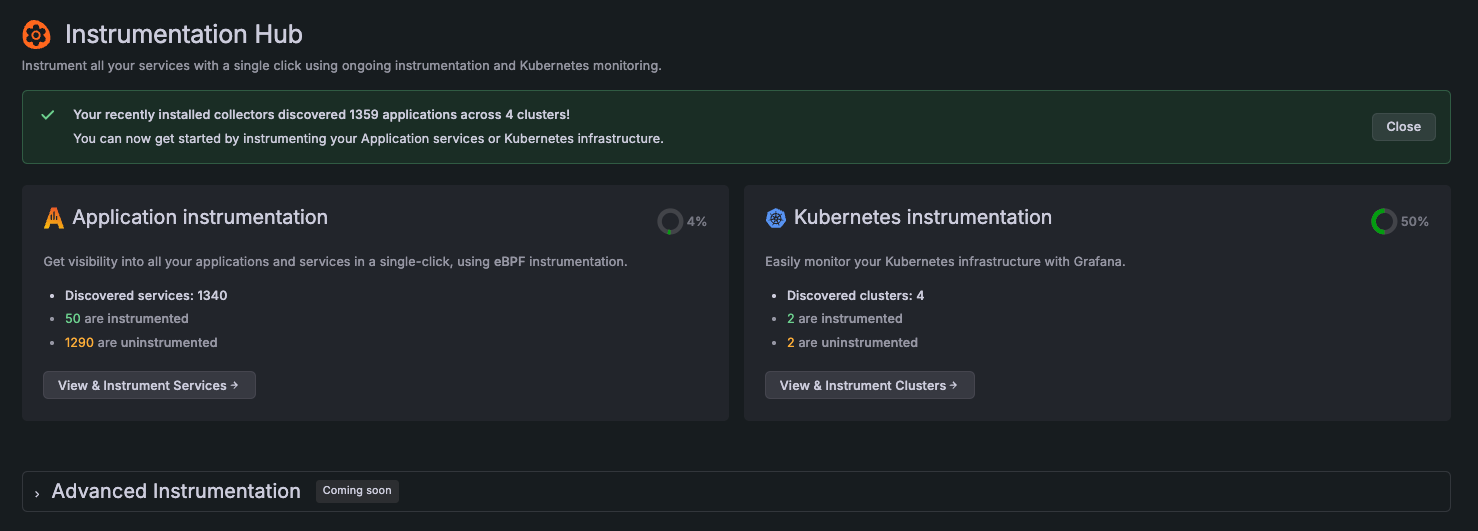
At the main page, a message indicates what has been discovered. Choose to begin instrumentation for application services or Kubernetes infrastructure.
Instrument application services
Complete the following steps to instrument application services.
At the Instrumentation Hub, click View & Instrument Services in the Application instrumentation tile.
To choose what to instrument, complete any of the following:
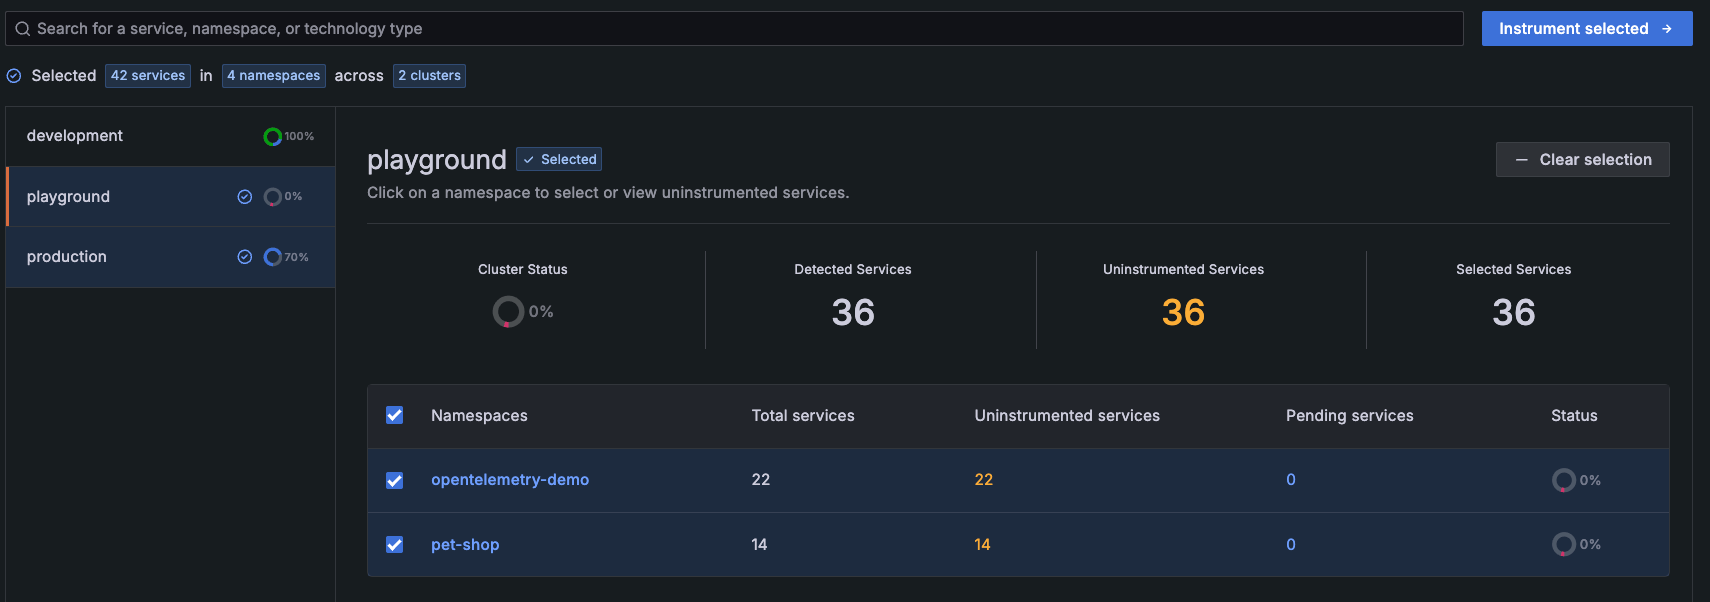
- Instrument a Cluster: Select a Cluster and click Select for instrumentation. This selects the Cluster and the namespaces within it. You can continue this process with another Cluster if you want to instrument multiple Clusters.
![All uninstrumented Clusters and their namespaces selected for instrumentation All uninstrumented Clusters and their namespaces selected for instrumentation]()
All uninstrumented Clusters and their namespaces selected for instrumentation - Instrument the entire namespace: Select the checkbox next to the namespace.
- Instrument an individual service: Click the name of the namespace. Then select the box next to the service.
To remove your instrumentation choice, click Clear selection.
- Instrument a Cluster: Select a Cluster and click Select for instrumentation. This selects the Cluster and the namespaces within it. You can continue this process with another Cluster if you want to instrument multiple Clusters.
Click Instrument selected.
Note
If you have not activated application services, you are interrupted after you click Instrument selected or Select for instrumentation. You cannot continue instrumentation until you activate the product. To continue, click Activate to activate Application services.
Confirm your selection at the Review Selection page, then click Continue.
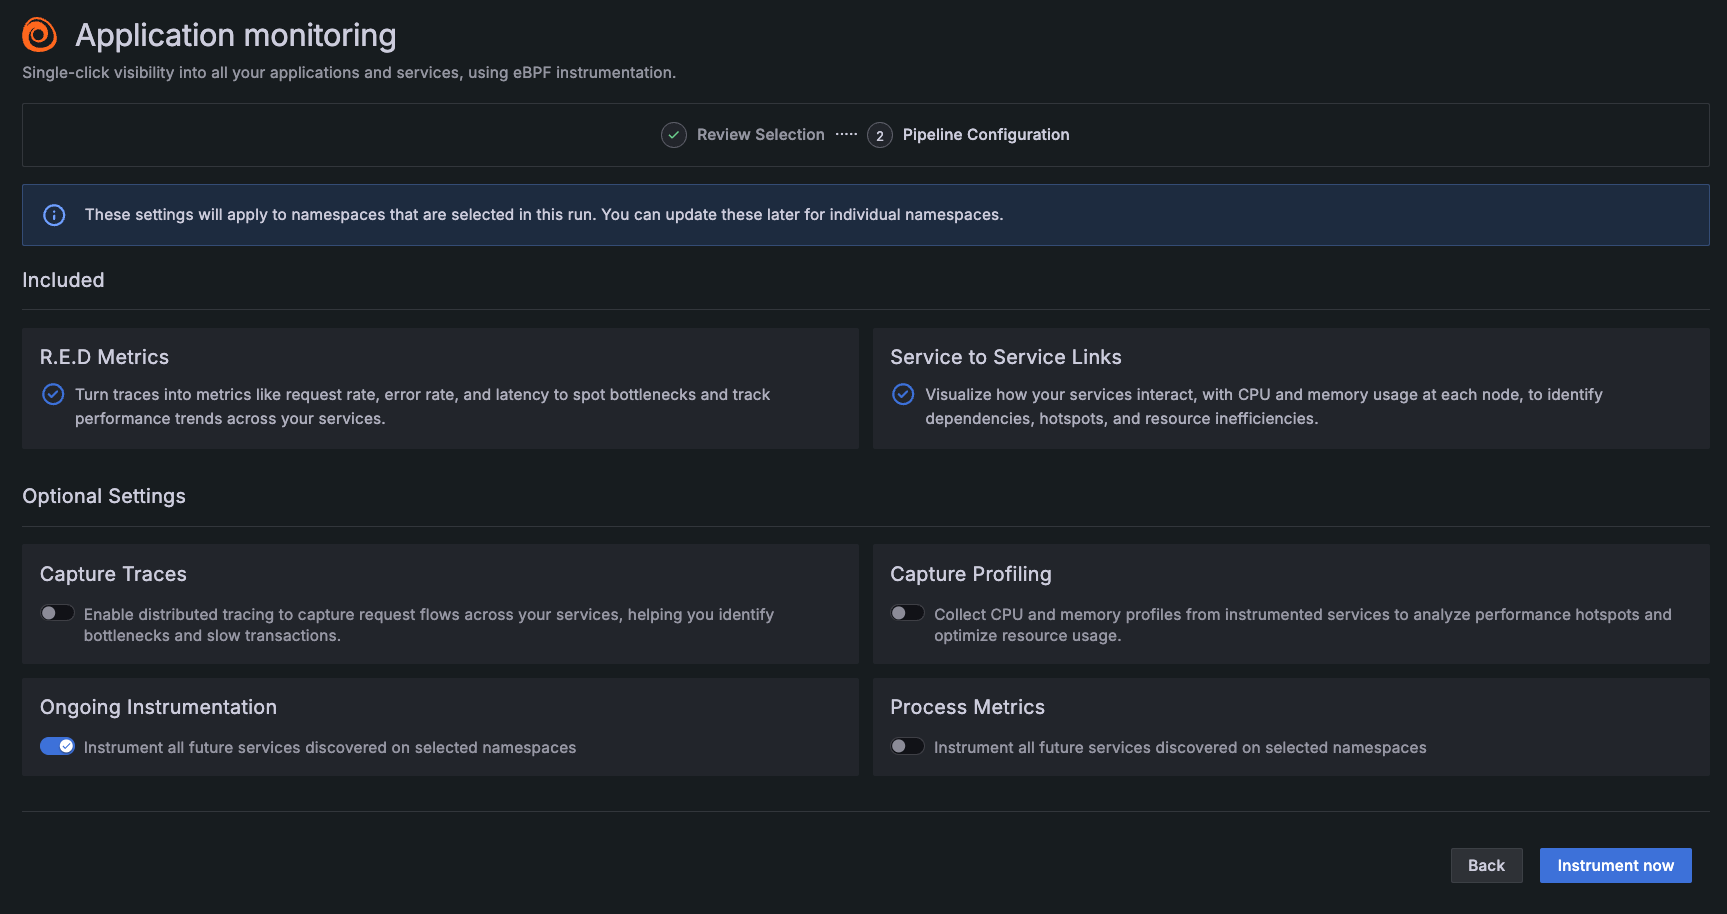
View the optional settings on the Advanced Settings page.
Notice that the following are included as part of instrumentation:
- R.E.D. Metrics: Turns traces into metrics
- Service to Service links: For visualizing how your services interact
![Additional options for application data sources Additional options for application data sources]()
Additional options for application data sources Switch on any of these optional selections:
- Ongoing Instrumentation: To have any new services that are discovered in the future be instrumented after discovery
- Application Logs: To capture application logs for centralized searching, analysis, and correlation with traces and metrics
- Process Metrics: To capture metrics about processes that are running the instrumented application
- Traces: To capture traces for services that are instrumented
- Profiling: To capture profiles for services that are instrumented
- Extended Application Metrics: To capture additional application metrics using OpenTelemetry semantic conventions for custom visualizations
Click Instrument now.
Note
Instrumentation can take up to 1.5 minutes, depending on the amount of items you have chosen to instrument.
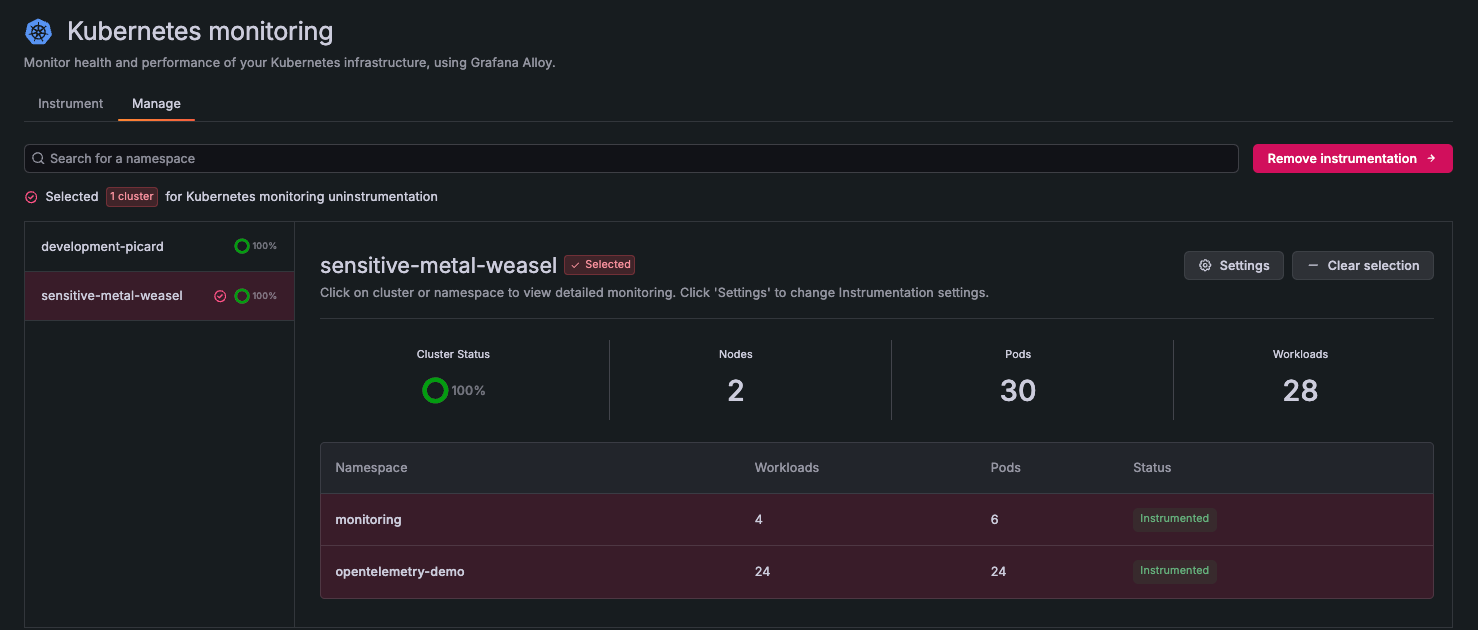
If you have additional services that are not instrumented, you return to the Instrument tab. To view the services that are instrumenting or have been instrumented, click the Manage tab. Here you can remove instrumentation and navigate to settings of a namespace.
If there are no additional namespaces to be instrumented, you are taken to the Manage tab.
Instrument Kubernetes Clusters
Complete the following steps to instrument Kubernetes Clusters.
Click View & Instrument Clusters in the Kubernetes instrumentation tile.
To choose what to instrument, complete any of the following:
- Instrument a Cluster: Select a Cluster and click Select for instrumentation. This selects the Cluster and the namespaces within it. You can continue this process with another Cluster if you want to instrument multiple Clusters.
![A Cluster selected for instrumentation A Cluster selected for instrumentation]()
A Cluster selected for instrumentation To remove your instrumentation choice, click Clear selection.
Click Instrument selected.
Note
If you have not activated Kubernetes Monitoring, you are interrupted after you click Instrument selected or Select for instrumentation. You cannot continue instrumentation until you activate the product. To continue, click Activate to activate Kubernetes Monitoring.
Confirm your selection at the Review Selection screen, then click Continue.
View the optional settings at the Advanced Settings page.
Notice that Cluster-wide metrics are already selected as part of the settings.
Switch on any of these optional selections:
- Cluster events
- Node logs, to capture journald logs from the Nodes
Click Instrument now.
Note
Instrumentation can take up to 1.5 minutes, depending on the amount of items you have chosen to instrument.
If you have additional services that are not instrumented, you are returned to the Instrument tab. To view the services that are instrumenting or have been instrumented, click the Manage tab. Here you can remove instrumentation and navigate to the settings of a Cluster.
If there are no additional Clusters to be instrumented, you are taken to the Manage tab.
![The instrumentation hub for quickly instrumenting Kubernetes infrastructure and applications The instrumentation hub for quickly instrumenting Kubernetes infrastructure and applications]()
The instrumentation hub for quickly instrumenting Kubernetes infrastructure and applications
Manage instrumentation and settings
From the Manage tab, you can:
- View and change the settings you chose for any Cluster or namespace
- Remove instrumentation
- Go directly to a Kubernetes namespace or application service by clicking on it after instrumentation
Application namespace settings
At the Manage tab for application monitoring, highlight the Cluster.
To view the settings for a namespace, perform either of these steps.
- Click the name of the namespace. This shows a list of services within the namespace. Click Settings.
- In the row of the namespace, click the gear icon. This shows the settings of the namespace without showing the list of services.
To make changes, switch on or off any optional settings.
Click Apply.
Remove instrumentation from application services
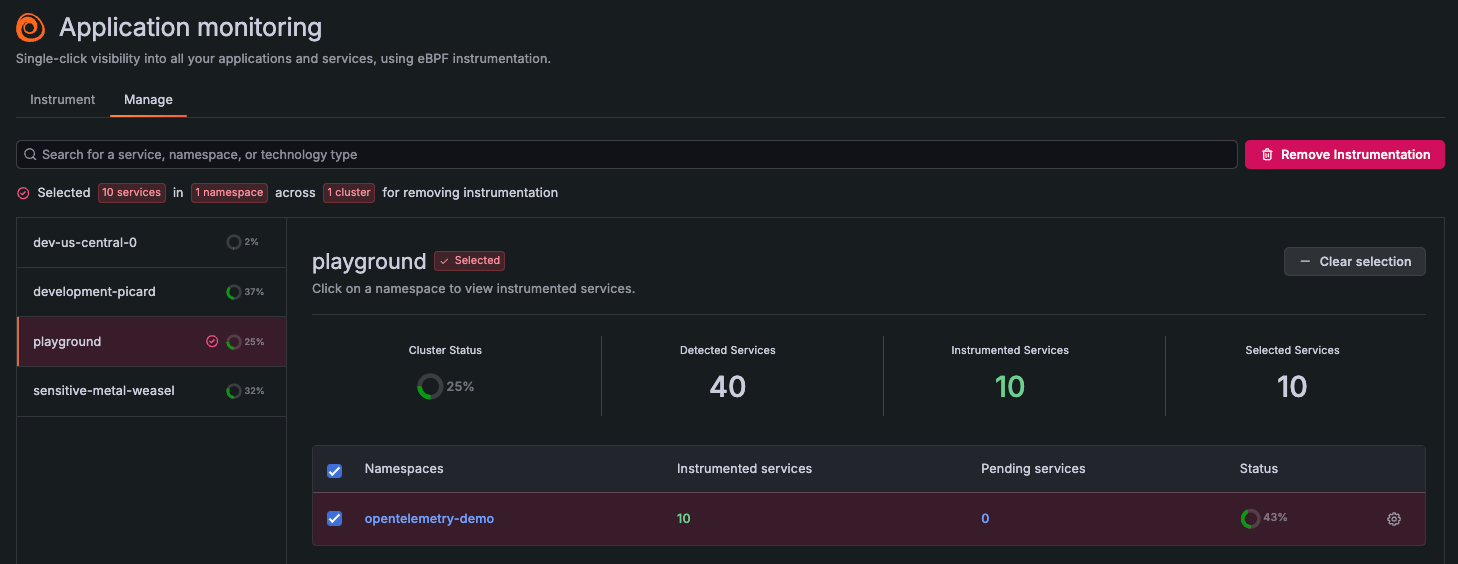
You can remove instrumentation from any service in the Manage tab.
To choose what to remove from instrumentation, you can:
- Select the entire Cluster: Select the Cluster. Then select the checkbox next to the namespace to select all services, and click Remove Instrumentation.
- Select individual services: Select the Cluster, select the checkbox next to the namespace, and click Remove Instrumentation.
- Select individual services: Click the Cluster, click the namespace, select the box next to the service, and click Remove Instrumentation.
![Service selected for instrumentation removal Service selected for instrumentation removal]()
Service selected for instrumentation removal To remove your choice, click Clear selection.
Review your selection at the confirmation screen, then click Uninstrument.
Kubernetes Cluster settings
At the Manage tab for Kubernetes monitoring, highlight the Cluster.
Click Settings.
To make changes, switch on or off any optional settings.
Click Apply.
Remove instrumentation from Kubernetes
You can remove instrumentation from any Cluster in the Manage tab.
Select the Cluster you want to remove, and click Remove Instrumentation.
To remove your choice, click Clear selection.
Review your selection at the confirmation screen, then click Uninstrument.
![Cluster selected for instrumentation removal Cluster selected for instrumentation removal]()
Cluster selected for instrumentation removal
Activate an observability product
To use a Grafana Cloud observability product for Kubernetes or application monitoring, you must first activate it. Activation allows your use of the product and begins host-hours billing. Even with an activated product, you are not billed until metrics are sent to Grafana Cloud.
To learn more about billing, refer to:
To deactivate, refer to:
Build the Grafana Knowledge Graph
You can build a correlated view of your data with the Knowledge Graph so you don’t need to document your inventory and its entity connections, or guess the health and performance of entities in your system.
Knowledge graph is an underlying technology that:
- Provides an inventory of all system entities and their connections
- Rates the performance and health of connections between services
- Allows you to navigate between infrastructure and application services without losing context

