Important: This documentation is about an older version. It's relevant only to the release noted, many of the features and functions have been updated or replaced. Please view the current version.
Grafana Cloud Alerting
Grafana Cloud Alerting allows you to create and manage all of your Prometheus-style alerting rules, for both Prometheus metrics and Loki log data. With this feature, you don’t need to leave Grafana, upload or edit configuration files, or install additional tools.

Permissions
All members of an organization that have alerts set up can view alerts in Grafana Cloud Alerting. This includes everyone with a Viewer, Editor, or Admin role.
Users with the organization Admin role can also create, edit, or delete alerts.
Data sources
Grafana Cloud Alerting supports rule management across multiple data sources, for both metrics and logs, across all of the stacks in your org. If you have more than one Prometheus or Loki data source, there will be a dropdown at the top for you to select the data source to configure rules.
Note
Pay attention to which data source you select. Cloud alerts are tied to a specific data source. For example, if you have a Loki data source selected you will not be able to create an alert based on a Prometheus data source.
Alerts and recording rules
Prometheus supports two types of rules:
- Recording rules - Recording rules allow you to execute expressions or queries, by saving them off as a stored rule instead.
- Alerting rules - Alerting rules allow you to define alert conditions and to route those notifications to an external service. An alert fires if metrics meet criteria defined in the alerting rule.
Both of these rules are configurable from the Grafana Cloud Alerting interface and configured in the same way.
Alert states
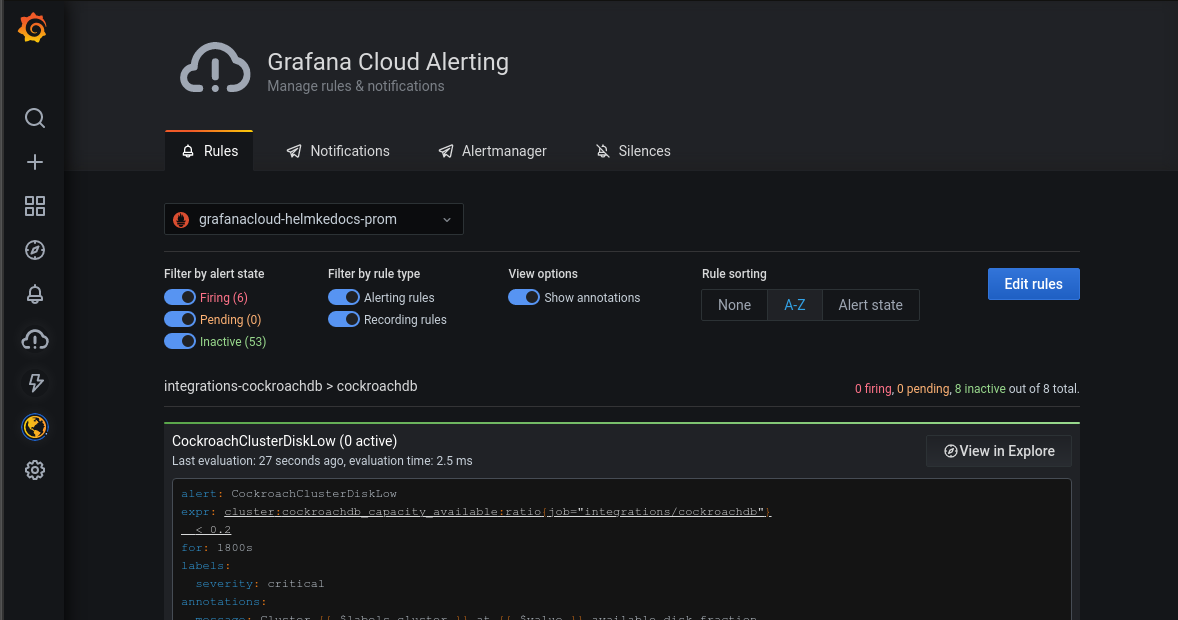
Alert states are identical to the standard format found in Prometheus rule configurations. In Grafana Cloud Alerting, each individual alert is highlighted by its state to more clearly distinguish between alerts.
- Firing - Alerts that have been active for longer than the configured threshold. Alerts are highlighted in red and tagged with a red
firinglabel. - Pending - Alerts that have been active for less than the configured threshold. Alerts are highlighted in orange.
- Inactive - Alerts that are neither firing nor pending. Alerts are highlighted in green.
Notifications
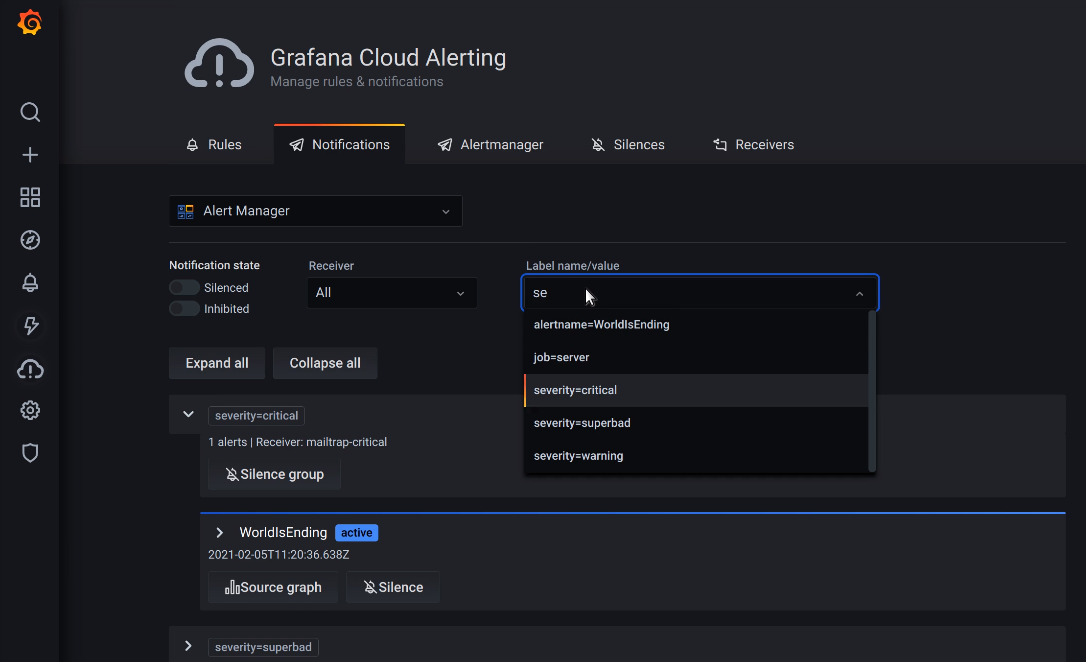
The Notifications tab is where you can view all current notifications and sort them by various states, receivers, and labels.

Limits
There is a limit on how many rules can be created in a rule group. There is also a limit on how many rule groups can be created.
You can create:
- 20 rules per rule group
- 35 rule groups
It is possible to increase these limits. Please contact customer support for further information.
If you exceed the limits, you will encounter an error similar to this:
ERROR[0000] requests failed fields.msg="request failed with response body
per-user rules per rule group limit (limit: 20 actual: 22) exceeded\n"
status="400 Bad Request"
ERROR[0000] unable to load rule group  error="failed request to the cortex api"
group=limit_rules_per_group namespace=test
To increase the number of rules or rule groups you can configure, contact support to upgrade your account.


