
Note
Alerts page is currently in public preview. Grafana Labs offers limited support, and breaking changes might occur prior to the feature being made generally available.
Alert view
Grafana Alerting provides a consolidated snapshot of your firing and pending Grafana-managed alerts in a simplified view. For users with complex deployments, it can be difficult to monitor and prioritize critical incidents among a large volume of firing or pending alerts. With the Alert page, you have a view where you can quickly explore and sort your recent alert history and see what alerts require review or action.
To see your firing and pending alerts in the alert page, go to Alerts & IRM > Alerting > Alert activity.
How it works
The Alerts page only shows alerts from Grafana-managed alert rules. Grafana uses a metric called GRAFANA_ALERTS, which is recorded in the default Mimir data source that is provisioned for cloud users.
Note
OSS users need to manually configure this. To configure alert state history for OSS, refer to the configure Loki and Prometheus for alert state documentation.
Filter alerts in the Alerts page
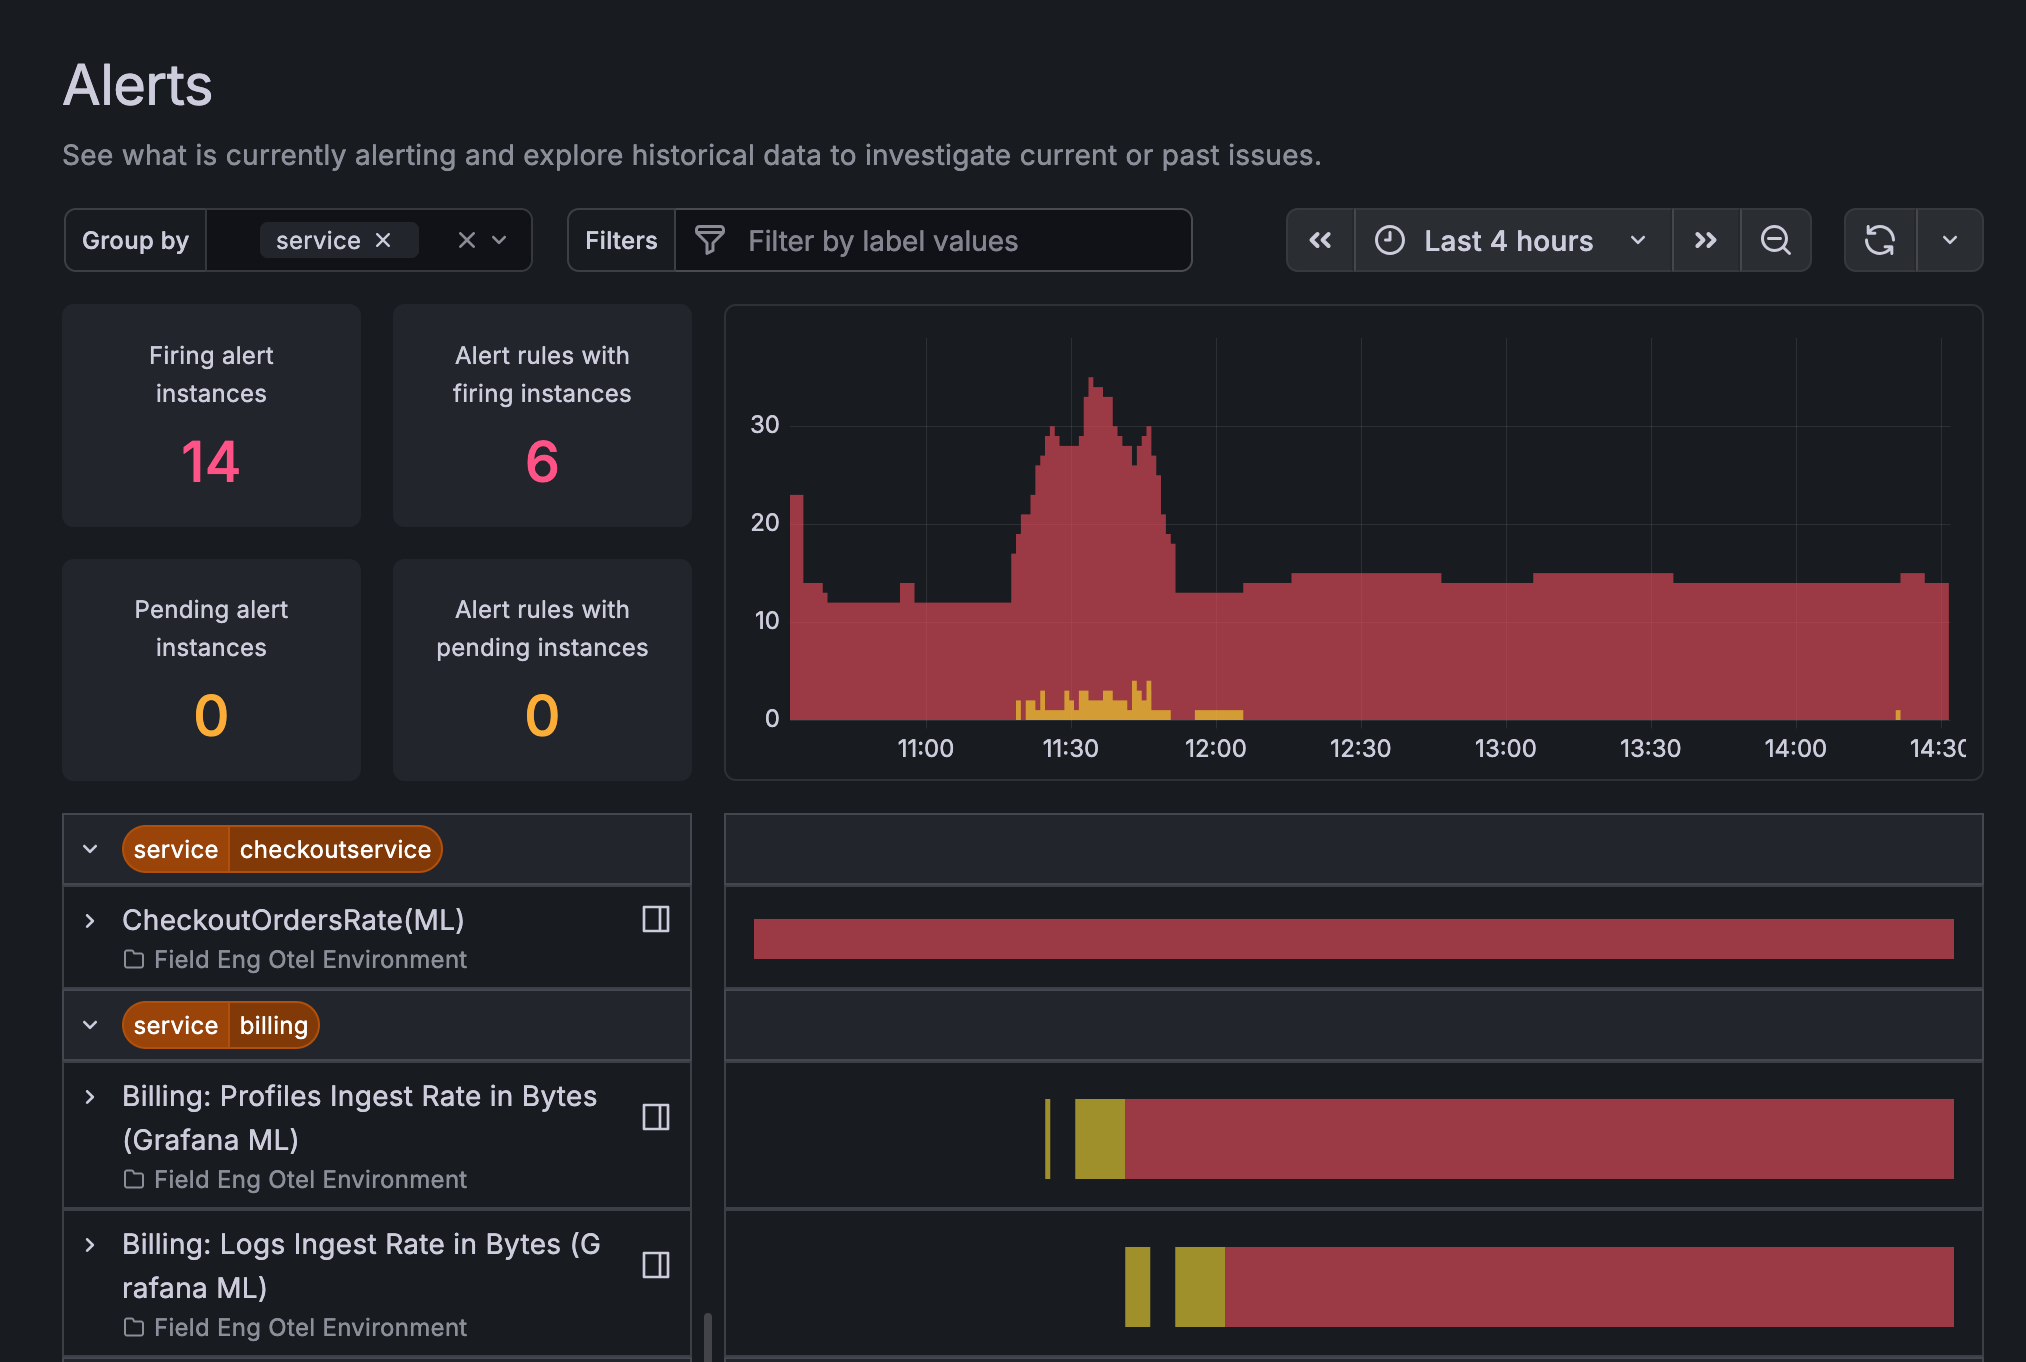
The page displays the count of alert rules and instances that are both firing and pending. Use the filters to group your alerts and find specific alerts by label.
To group alerts by label, click the Group by field and select the labels from the dropdown menu. You can select multiple labels for alert grouping.
To filter by specific label values, click the Filters field and select a label to filter by, followed by an expression of what label value you want to use. You can enter multiple label values in your search.
You can also select a time range from the time picker to further adjust your results. Click the time range field and enter an absolute time range or select a period from the quick ranges list to apply a new time window to the display results.


