Menu
Enterprise

Trace structure and TraceQL

Inspired by PromQL and LogQL, TraceQL uses similar syntax and semantics. The differences being inherent to the very nature of searching spans and traces.

Trace structure

Traces are telemetry data structured as trees. Traces are made of spans (for example, a span tree); there is a root span that can have zero to multiple branches that are called child spans. Each child span can itself be a parent span of one or multiple child spans, and so on so forth.

Trace_and_spans_in_tree_structure

In the specific context of TraceQL, a span has the following associated fields:

  • name: the span name
  • duration: difference between the end time and start time of the span
  • status: enum: {ok, error, unset}. For details, refer to OTel span status documentation.
  • kind: enum: {server, client, producer, consumer, internal, unspecified}. For more details, refer to OTel span kind documentation.
  • Attributes

The first four properties are intrinsics. They are fundamental to the span.

Attributes are custom span metadata in the form of key-value pairs. There are four types of attributes: span attributes, resource attributes, event attributes, and link attributes.

Span attributes are key-value pairs that contain metadata that you can use to annotate a span to carry information about the operation it’s tracking. For example, in an eCommerce application, if a span tracks an operation that adds an item to a user’s shopping cart, the user ID, added item ID and cart ID can be captured and attached to the span as span attributes.

A resource attribute represents information about an entity producing the span. For example, a span created by a process running in a container deployed by Kubernetes could link a resource that specifies the cluster name, namespace, pod, and container name. Resource attributes are resource-related metadata (key-value pairs) that are describing the Resource.

An event attribute represents a unique point in the time during the span’s duration. For more information, refer to All about span events and Span events in the OTEL documentation.

A link attribute lets you query link data in a span. A span link associates one span with one or more other spans that are a casual relationship. For more information on span links, refer to the Span Links documentation in the Open Telemetry project.

The OpenTelemetry specification defines Semantic Attributes for Spans and for Resources. Semantic Span Attributes are a set of naming schemes for attributes shared across languages, frameworks, and runtimes. For more details, refer to Trace Semantic Conventions and Resource Semantic Conventions.

TraceQL queries

The purpose of TraceQL is to search or query for spans. The query returns a set of spans, also called a spanset.

A TraceQL query can select traces based on:

  • span attributes, timing and duration
  • structural relationships between spans
  • aggregated data from the spans in a trace

As with PromQL and LogQL, the query is structured as a pipeline of operations (filters and aggregators). The query expression is evaluated on one trace at a time, selecting or discarding spans from the result. At each stage of the query pipeline, the selected spans for a trace are grouped in a spanset (set of spans). The associated trace is also returned. The result of the query is the spansets (and their associated traces) for all the traces evaluated.

The simplest query is this one:

{ }

The curly braces encompass the select/filter conditions. In theory, each span (and the trace it belongs to) matching those conditions is returned by the query. In the previous example, since there are no filter conditions, all spans are matching and thus returned with their associated traces.

In practice, the query is performed against a defined time interval, relative (for example, the last 3 hours) or absolute (for example, from X date-time to Y date-time). The query response is also limited by the number of traces (Limit) and spans per spanset (Span Limit).
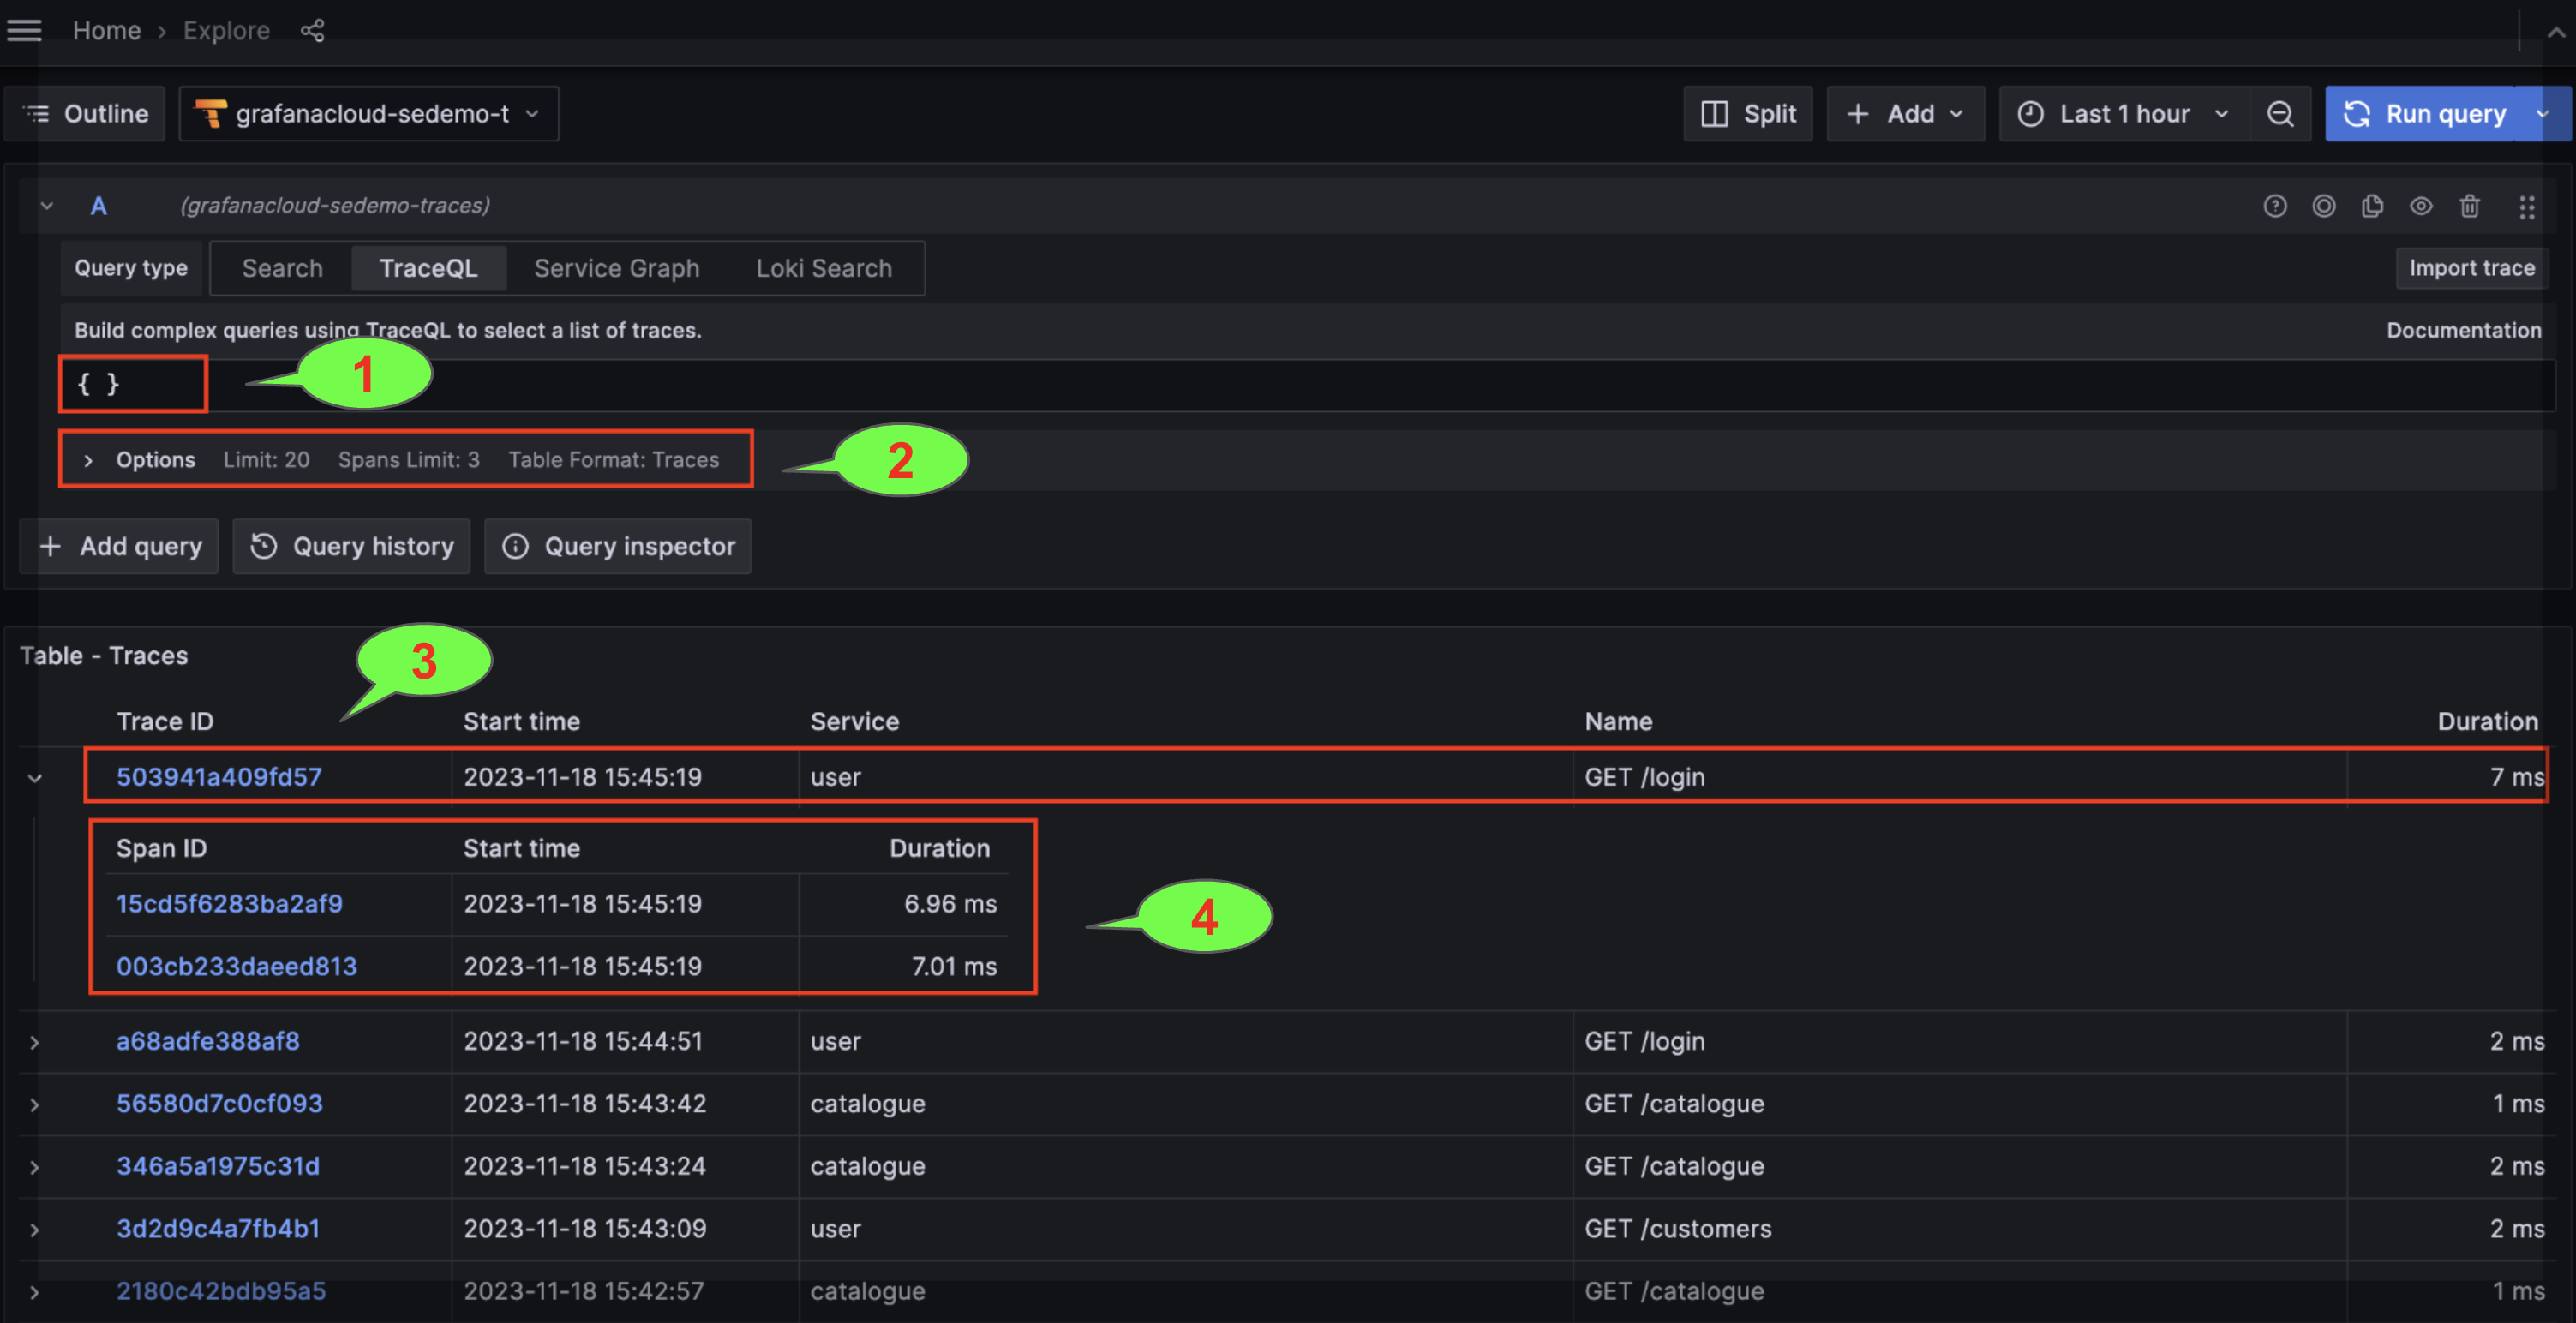
TraceQL in Grafana

  1. TraceQL query editor
  2. Query options: Limit, Span Limit and Table Format (Traces or Spans).
  3. Trace (by Trace ID). The Name and Service columns are displaying the trace root span name and associated service.
  4. Spans associated to the Trace