TraceQL queries in Grafana
You can compose TraceQL queries in Grafana and Grafana Cloud using Explore and a Tempo data source.
The Tempo data source’s query editor helps you query and display traces from Tempo in Explore. The queries use TraceQL, the query language designed specifically for tracing.
For general documentation on querying data sources in Grafana, refer to Query and transform data.
Query results can stream to the client, which lets you look at traces matching your query before the entire query completes.
To use streaming in Grafana, you must have stream_over_http_enabled: true enabled in Tempo.
For information, refer to
Tempo GRPC API.
Note
You can also use Traces Drilldown to explore your tracing data without writing queries. For more information, refer to the Traces Drilldown documentation.
Choose a query editing mode
The query editor has three modes, or Query types, that you can use to explore your tracing data. You can use these modes by themselves or in combination to create building blocks to generate custom queries.

The three Query types are:
- The Search query builder provides a user interface for building a TraceQL query.
- The TraceQL query editor lets you write your own TraceQL query with assistance from autocomplete.
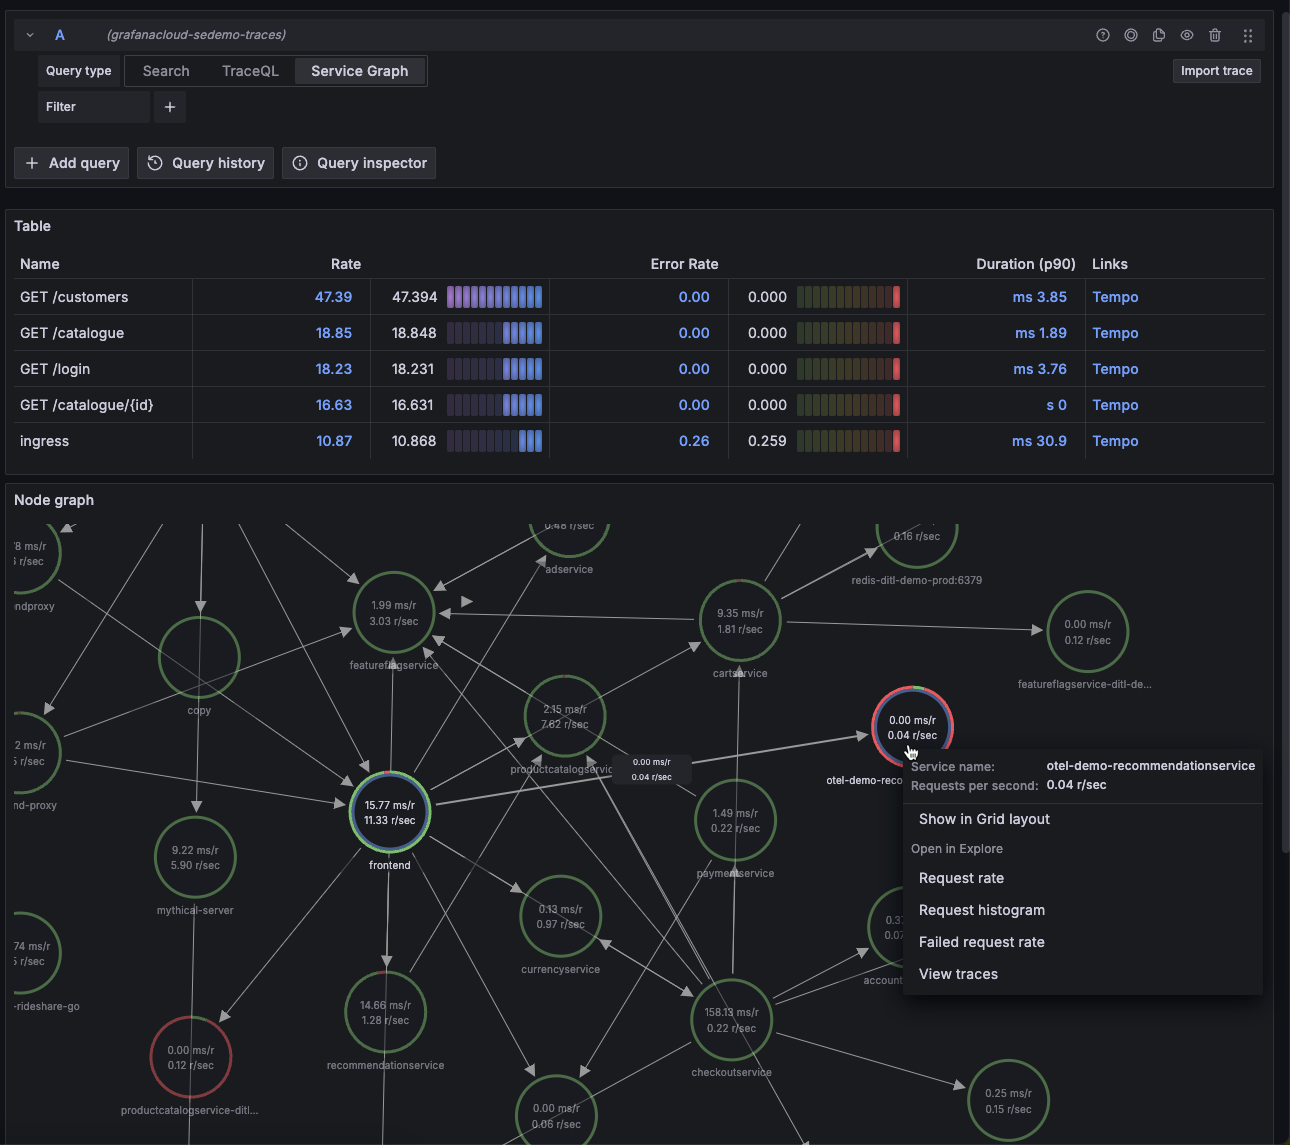
- The Service Graph view displays a visual relationship between services. Refer to the Service graph view documentation for more information.
Stream query results
Query results can stream to the client, which lets you look at traces matching your query before the entire query completes.
The GRPC streaming API endpoint in the query frontend allows a client to stream search results from Tempo.
The tempo-cli also uses this streaming endpoint.
For more information, refer to the
Tempo CLI documentation.
To use streaming in Grafana, you must have stream_over_http_enabled: true enabled in Tempo.
For information, refer to
Tempo GRPC API.
Search query builder
The Search query builder provides drop-down lists and text fields to help you write a query. The query builder is ideal for people who aren’t familiar with or want to learn TraceQL.
Refer to the Search using the TraceQL query builder documentation to learn more about creating queries using convenient drop-down menus.

TraceQL query editor
The TraceQL query editor lets you search by trace ID and write TraceQL queries using autocomplete.
Refer to the TraceQL query editor documentation to learn more about constructing queries using a code-editor-like experience.

You can also search for a Trace ID by entering a trace ID into the query field.
Service graph view
Grafana’s service graph view uses metrics to display span request rates, error rates, and durations, as well as service graphs. Once the requirements are set up, this pre-configured view is immediately available.
Using the service graph view, you can:
- Discover spans which are consistently erroring and the rates at which they occur
- Get an overview of the overall rate of span calls throughout your services
- Determine how long the slowest queries in your service take to complete
- Examine all traces that contain spans of particular interest based on rate, error, and duration values (RED signals)
For more information about the service graph, refer to Service graph view.

Use TraceQL panels in dashboards
To add TraceQL panels to your dashboard, refer to the Traces panel documentation.
To learn more about Grafana dashboards, refer to the Use dashboards documentation.


