
SQL Server Monitoring
Performance and health metrics for your SQL Servers using Telegraf and Prometheus
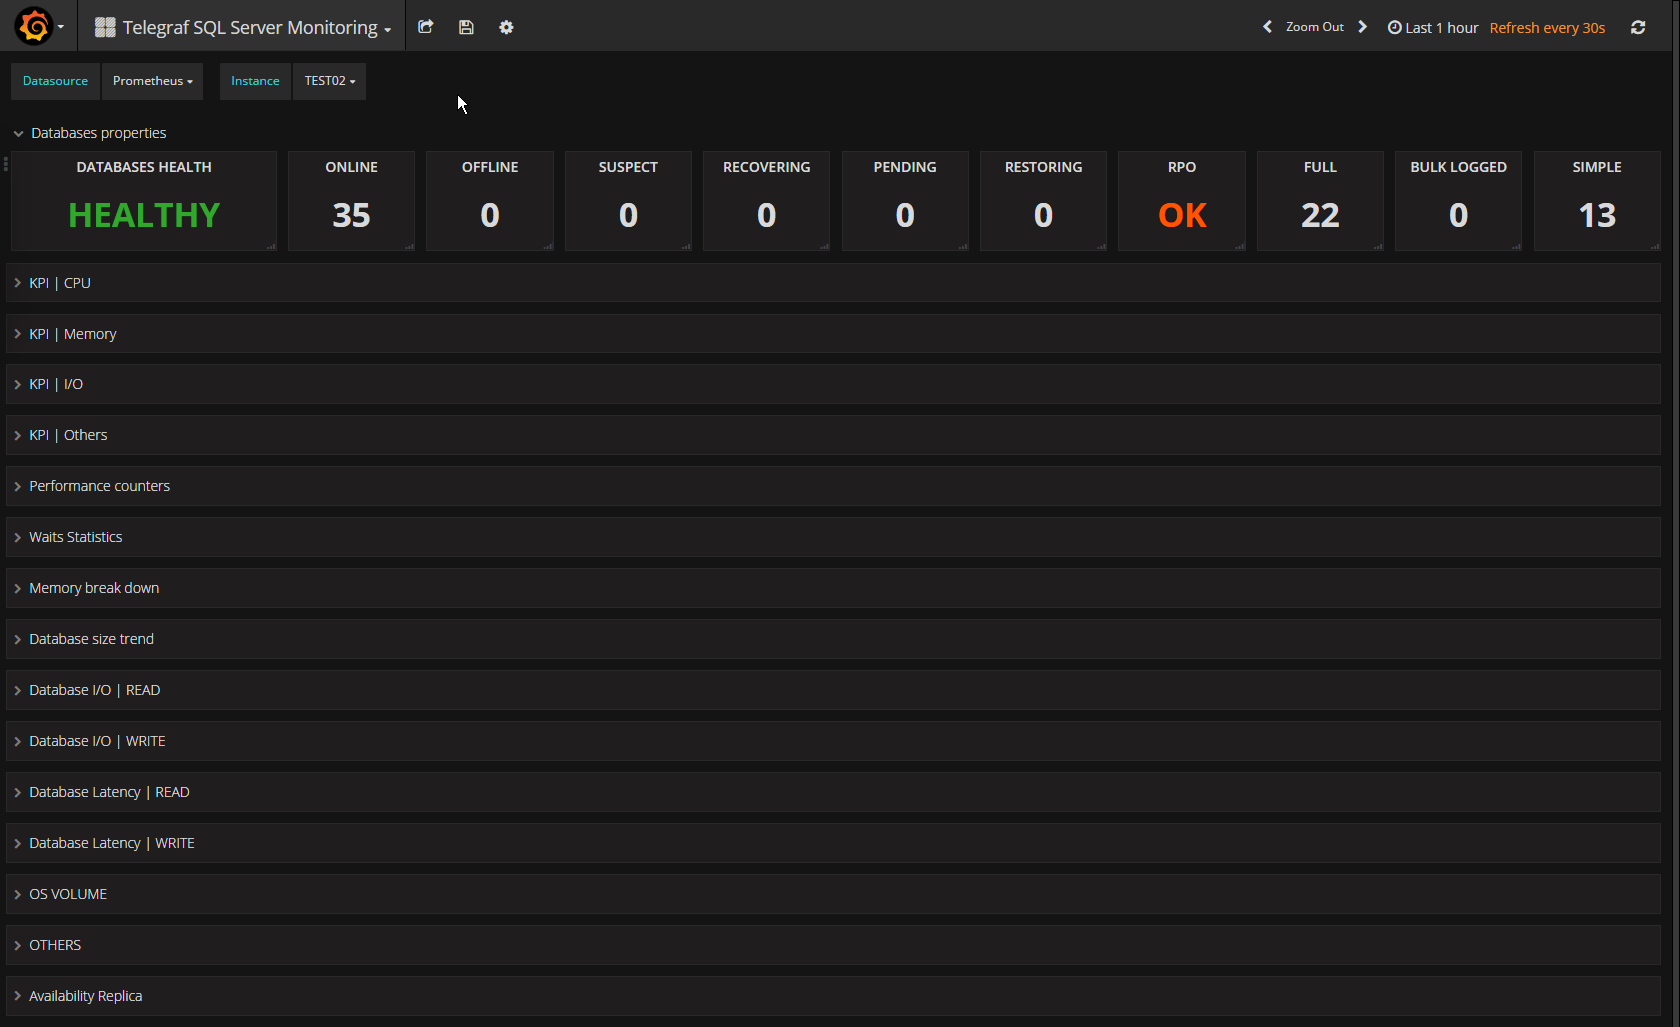
This is a Telegraf/Prometheus version of the Telegraf/InfluxDB SQL Server Monitoring dashboard. Please see link for more screenshots etc.
Data source config
Collector type:
Collector plugins:
Collector config:
Revisions
Upload an updated version of an exported dashboard.json file from Grafana
| Revision | Description | Created | |
|---|---|---|---|
| Download |