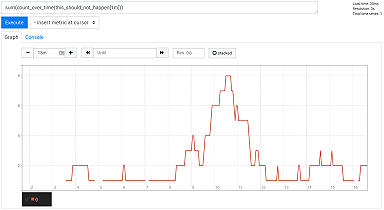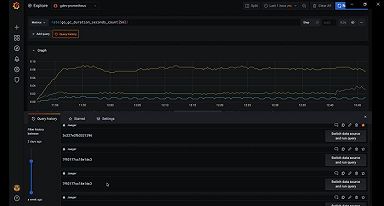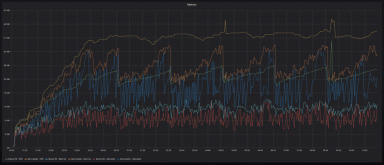
New in Prometheus v2.19.0: Memory-mapping of full chunks of the head block reduces memory usage by...
Read more
Read more
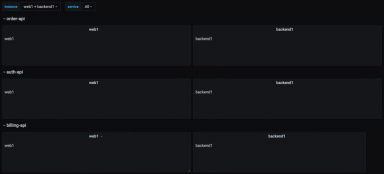
Build dynamic Grafana dashboards with the repeated panels feature — and avoid maintaining duplicated panels across your dashboards.
Read more
Read more
Read more
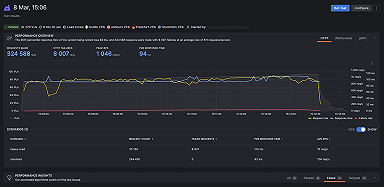
In this tutorial, you will discover how easy and fast is to integrate your k6 performance tests into Azure Pipelines.
Read more
Read more
Read more
Read more
Read more
Read more
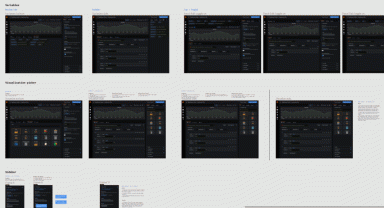
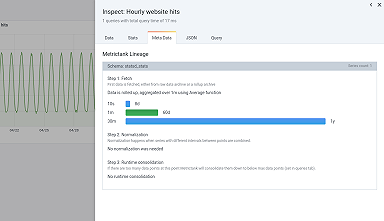
This blog will cover the new functionality around Metrictank metadata, the rollup indicator, and the lineage visualization coming in 7.0.
Read more
Read more
Read more
Read more
Read more
