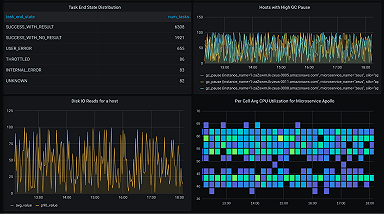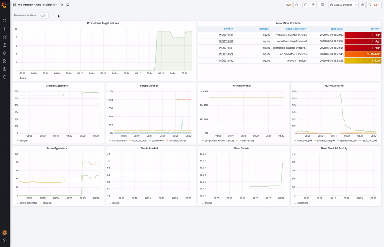
New features in the ServiceNow plugin for Grafana: table query, annotations, and more!
The ServiceNow plugin for Grafana now allows users to query tables, visualize data as annotations, and use ServiceNow for alerting.
Read more
The ServiceNow plugin for Grafana now allows users to query tables, visualize data as annotations, and use ServiceNow for alerting.
Read more
Read more
Read more
In this tutorial, we walk through how to integrate performance testing into your development process with GitLab and Grafana k6.
Read more
Read more
Read more
In this article, we explain how to use Grafana k6 to load test APIs that are secured with OAuth authentication on Microsoft Azure Active Directory and...
Read more
Read more
Read more
Use this tutorial to look into how to include k6 load tests in your Jenkins Pipeline setup.
Read more
How Loki reduces cost, streamlines operations, and builds better teams
Read more
Integrating Dynatrace with Grafana helps you create user-friendly, exec-ready dashboards from your Metrics API v2 data and custom metrics.
Read more
Read more
Read more
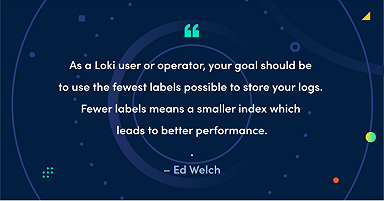
The concise guide to labels in Loki
Read more
