How we're graduating Grafana Agent experiments into the official Prometheus project
Every successful Grafana Agent experiment turns into an upstream contribution for the whole Prometheus community to benefit from.
Read more
Every successful Grafana Agent experiment turns into an upstream contribution for the whole Prometheus community to benefit from.
Read more
Read more
Read more
Read more
Read more
Read more
Read more
Read more
Read more
Set up a Grafana development environment on a Windows PC using the Windows Subsystem for Linux.
Read more
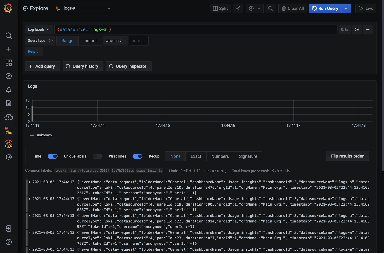
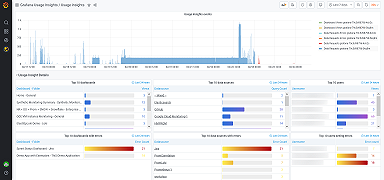
With Grafana 7.4, Grafana Enterprise users can export raw usage insights events as logs to Loki.
Read more
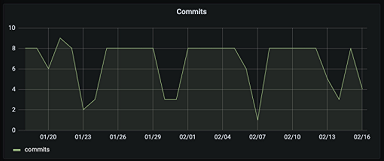
The GitLab data source plugin allows users to visualize development metrics and correlate them with events in Grafana.
Read more
Read more
Read more
The Splunk Infrastructure Monitoring plugin for Grafana enables a flexible view of your systems and applications to quickly correlate and debug.
Read more
