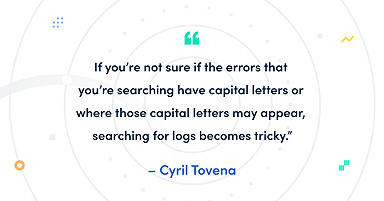
How to search logs in Loki without worrying about the case
Here's an easy solution to run a case-insensitive search in Loki.
Read more
Here's an easy solution to run a case-insensitive search in Loki.
Read more
Read more
Read more
Read more
Read more
Read more
Read more
Read more
Read more
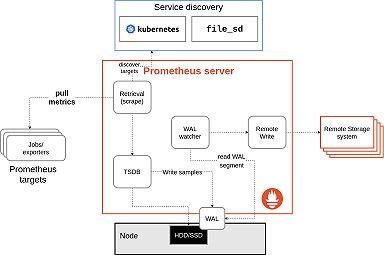
How Prometheus remote write issues can be solved using metrics and configurations
Read more
Read more
Read more
Read more
Read more
The Jira data source plugin in Grafana can give users across your organization comprehensive insights into their development process.
Read more
