New feature in Loki 2.4: no more ordering constraint
Read more
Read more
The updated Kubernetes integration for Grafana introduces new curated dashboards and built-in alerting to monitor your clusters.
Read more
With browser automation and expanded Prometheus support, k6 improves application performance and observability.
Read more
Grafana Cloud's Kubernetes integration makes it easier to troubleshoot and alert on your Kubernetes cluster.
Read more
A step-by-step tutorial on how to use the simple, scalable deployment for Grafana Loki and Grafana Enterprise Logs.
Read more
Grafana Cloud's fully managed integration for AWS CloudWatch pulls metrics with a few simple clicks and provides access to prebuilt dashboards,...
Read more
The Prometheus Agent mode from the Grafana Agent enables easier horizontal scalability.
Read more
This patch release includes security fixes that affect Grafana versions from v8.0.0 through v8.2.3.
Read more
Grafana Tempo 1.2 offers recent traces search, a scalable single binary operational mode, and increased efficiency for monitoring metrics.
Read more
Grafana OnCall Announcing Grafana OnCall, the easiest way to do on-call management in Grafana Cloud.
Read more
Grafana Labs launches new projects and features for oncall management, secure tracing, more efficient traces and logs, faster queries, and more!
Read more
Grafana Labs reveals the most popular data source plugins on grafana.com for 2021
Read more
Grafana 8.2.3 includes a medium severity security fix.
Read more
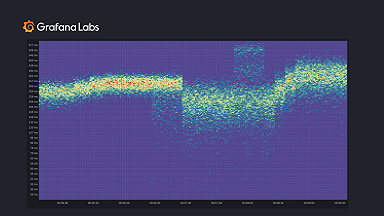
Early findings from a prototype show that sparse histograms can reduce index size and result in more efficient coding in Prometheus TSDB.
Read more
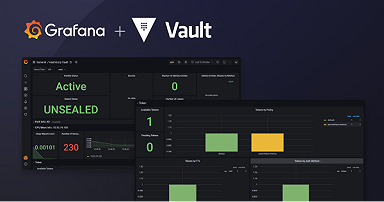
Grafana Labs announces new Vault integrations to make monitoring metrics and logs easier with Grafana.
Read more
