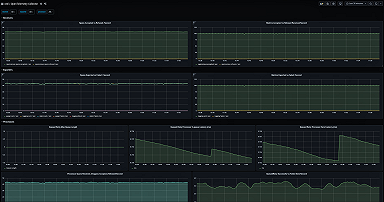
How to collect Prometheus metrics with the OpenTelemetry Collector and Grafana
How to scrape Prometheus metrics with the OpenTelemetry Collector and send them to a remote write destination like Grafana Cloud.
Read more
How to scrape Prometheus metrics with the OpenTelemetry Collector and send them to a remote write destination like Grafana Cloud.
Read more
The trace to log enablement for Splunk will give you deeper insights from your Splunk log data.
Read more
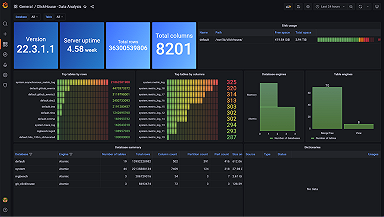
The new first-party ClickHouse plugin comes with pre-configured dashboards and alerts in Grafana.
Read more
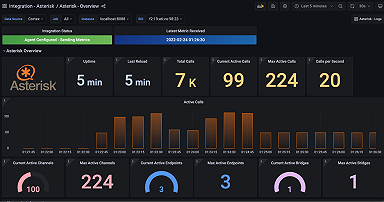
The new Asterisk integration for Grafana Cloud allows you to easily monitor an Asterisk system by following a few simple steps.
Read more
Learn how use the OpenTelemetry Java instrumentation agent for exposing Spring's metrics directly in OpenTelemetry format.
Read more
Grafana Mimir maintainers join the "Grafana's Big Tent" podcast to give you a behind-the-code look at developing the most scalable open source time...
Read more
New features in Grafana Tempo 1.4 allow you to generate metrics from your traces, offer more tools to improve search speed, and provide more...
Read more
Here's a look at two key tools we use at Grafana Labs to test the integration between our various services at deployment-time.
Read more
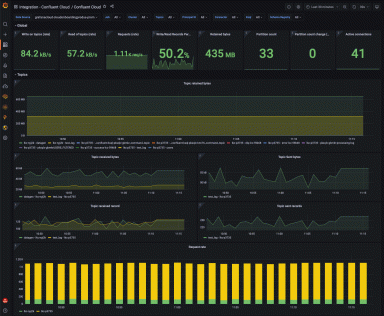
The fully managed Confluent Cloud integration makes it simple to monitor and visualize your Confluent Cloud resources in Grafana.
Read more
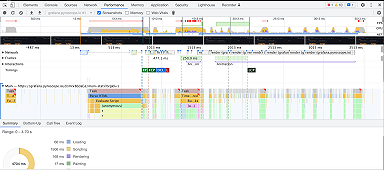
In this blog post, we provide an introductory guide to continuous profiling.
Read more
A step-by-step guide to setting up a Spring Boot app and correlating your metrics, logs, and traces in Grafana Cloud.
Read more
In this easy-to-follow demo, we will show you how simple it is to migrate your metrics to a new Grafana Mimir instance.
Read more
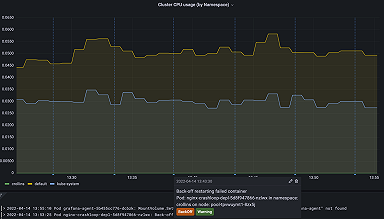
The latest features in the Kubernetes integration for Grafana Cloud support Kubernetes events, allow for collecting and shipping container logs,...
Read more
Grafana 8.5 has been released with features focused on ease of use, new data visualizations, and enhanced security.
Read more
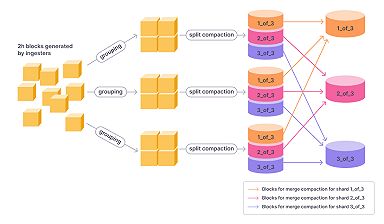
Grafana Mimir's split-and-merge compactor enables us to easily scale horizontally and ingest 1 billion active series
Read more
