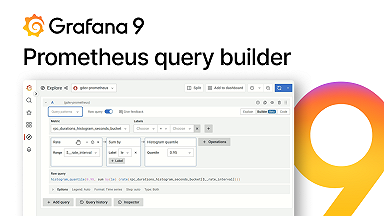
New in Grafana 9: The Prometheus query builder makes writing PromQL queries easier
Read more
Read more
Read more
Read more
Read more
Read more
Read more
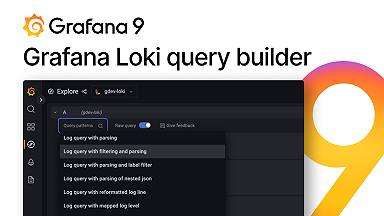
Simple and complex LogQL queries just got easier with the new Grafana Loki query builder in Grafana 9.
Read more
Read more
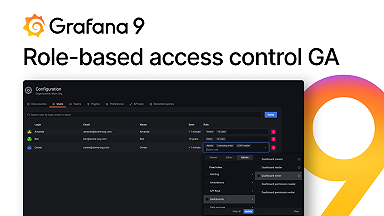
RBAC gives you more control over setting up access for all your Grafana users.
Read more
Learn how to configure the OpenTelemetry Collector to collect container and system logs with Fluent Forward and Filelog receivers and send them to...
Read more
With the k6 operator, running distributed load tests on Kubernetes is now easier than ever.
Read more
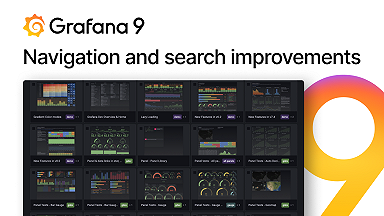
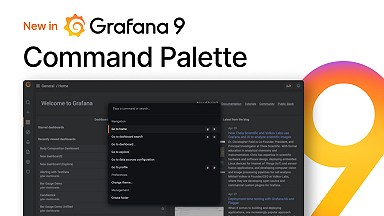
With the release of Grafana 9, you can now navigate Grafana with a few simple keystrokes.
Read more
Grafana OnCall is now open source for self-managed and on-premises deployments.
Read more
The Grafana 9.0 release is here! Check out all the new features in Grafana's user experience, accessibility, panel and dashboard searchability, and...
Read more
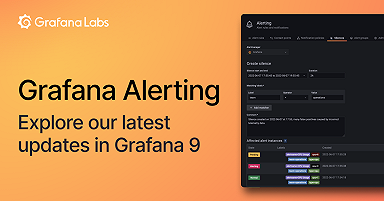
Grafana Alerting is now the default alerting system in Grafana, and we are introducing significant improvements based on your feedback, as well as...
Read more

