Announcing Grafana Mimir, the most scalable open source TSDB in the world
Grafana Labs' new open source project, Grafana Mimir, allows you to scale to 1 billion metrics and beyond.
Read more
Grafana Labs' new open source project, Grafana Mimir, allows you to scale to 1 billion metrics and beyond.
Read more
With the launch of our new open source TSDB, we collected questions from Grafanistas and Raj answered them.
Read more
In this tutorial video, we show you how to set up the New Relic data source plugin for Grafana and some of its most popular features.
Read more
Search capability across your 30-day trace retention is now available in beta in Grafana Cloud Traces.
Read more
Update on the Okta Lapsus$ breach: At this time, Grafana Labs has no reason to believe it has been impacted by the Okta Lapsus$ breach.
Read more
Get started with Grafana OnCall: learn how to configure alerts from different data sources and personalize notifications with our new on-call...
Read more
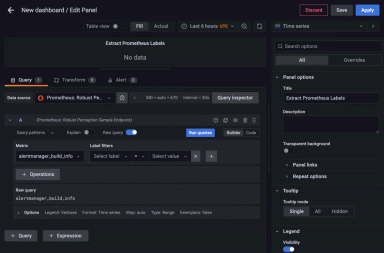
Relabeling in Prometheus is a powerful tool that allows you to classify and filter Prometheus targets and metrics.
Read more
Read more
Here are the best practices for using Teams, Orgs, and Instances in Grafana.
Read more
Avoid false or flapping alerts with this guide to alerting best practices for the Synthetic Monitoring app in Grafana Cloud.
Read more
The Apache Spark integration for Grafana Cloud provides a pre-built dashboard to unify data around Worker Nodes and related jobs in your Apache Spark...
Read more
The NSQ integration for Grafana Cloud helps monitor the real-time distributed messaging platform at scale.
Read more
This tutorial explores various options to integrate performance testing into CircleCI with Grafana k6.
Read more
Tips and tricks for using the new full-range log volume functionality in Grafana, which allows users to see a histogram of their log distribution over...
Read more
An in-depth look at the CKMS algorithm and how it works with summary metrics in Prometheus.
Read more