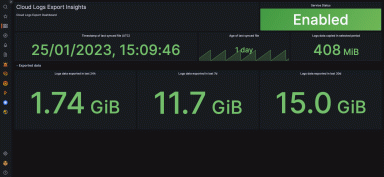
Retain logs longer without breaking the bank: Introducing Grafana Cloud Logs Export
Whether it's for compliance purposes or to analyze past incidents, use Grafana Cloud Logs Exporter to transfer your logs — for free! — to your own...
Read more
Whether it's for compliance purposes or to analyze past incidents, use Grafana Cloud Logs Exporter to transfer your logs — for free! — to your own...
Read more
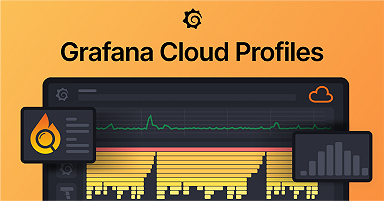
Grafana Cloud Profiles enables teams to understand how efficiently they are using resources and correlate profiles with metrics, logs, and traces.
Read more
Read more
Read more
Read more
Explore the similarities and differences between Grafana k6 browser and Google Lighthouse for measuring web performance.
Read more
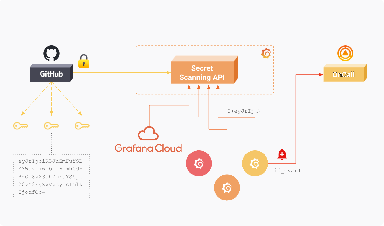
Through a new partnership, Grafana Labs and GitHub will work together to reduce the risk of data leaks for users on public repositories.
Read more
Read more
Read more
Read more
Read more
Read more
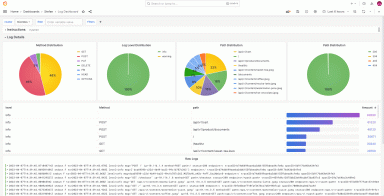
By creating use case-specific log dashboards with special filters, pie charts, and data links, you can make your debugging workflow more efficient.
Read more
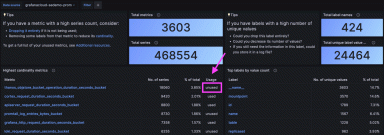
How to find and cut costly, unused metrics in Grafana Cloud with Cardinality Management dashboards.
Read more
Read more
