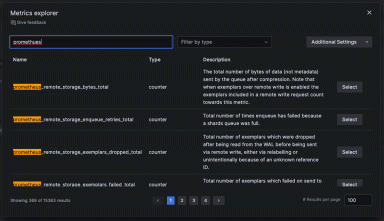
Build better PromQL queries with Grafana's metrics explorer
Read more
Read more
Learn why Grafana Labs chose React to power the frontend of the Grafana data visualization platform.
Read more
Whether you’re new to Grafana Loki or an experienced user, these video demos will help you learn more about our open source log aggregation system.
Read more
Read more
Read more
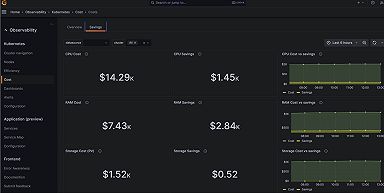
Use Kubernetes cost monitoring, a feature of the Kubernetes Monitoring solution in Grafana Cloud, to help manage the cost of cloud resources that your...
Read more
Our answer to safely monitoring private network data is Private Data Source Connect (PDC), which is available now in public preview in Grafana Cloud...
Read more
Read more
Read more
Read more
The excitement around Grafana 10 continued throughout the second full day of sessions at GrafanaCON 2023.
Read more
The first full day of GrafanaCON 2023 kicked off with the release of Grafana 10, and celebrated unique Grafana use cases from the community.
Read more
Dynamic visualizations. Enhanced security. Better collaboration. Check out all the features Grafana 10 has to offer.
Read more
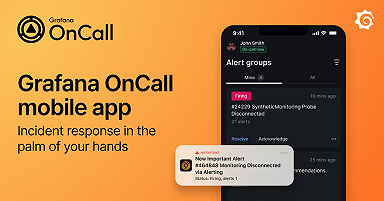
With the new OnCall mobile app, you can receive and manage alerts, configure notification policies, check your schedule, and more — all from your...
Read more
Learn what’s new in Grafana Agent v0.34, including new functionality for Kubernetes monitoring and support for HashiCorp Vault.
Read more


