Grafana Agent v0-38 release: new OpenTelemetry components, configuration improvements, and more
The latest Grafana Agent release includes new OpenTelemetry components, configuration improvements, enhanced log collection.
Read more
Products
Grafana Cloud
Monitor, analyze, and act faster with AI-powered observability.
LGTM+ Stack
Key Capabilities
Observability Solutions
end-to-end integrations
Opinionated integrations that help you get there easier and faster
monitor infrastructure
Out-of-the-box KPIs, dashboards, and alerts for observability
visualize any data
Instantly connect all your data sources to Grafana
Grafana Cloud
Monitor, analyze, and act faster with AI-powered observability.
The actually useful free plan
10k series Prometheus metrics
50GB logs, 50GB traces, 50GB profiles
500VUh k6 testing
20+ Enterprise data source plugins
100+ pre-built solutions
3 active AI users
Opinionated integrations that help you get there easier and faster
Instantly connect all your data sources to Grafana
Getting started with managing your metrics, logs, and traces using Grafana
Learn how to unify, correlate, and visualize data with dashboards using Grafana.
The latest Grafana Agent release includes new OpenTelemetry components, configuration improvements, enhanced log collection.
Read more
With this step-by-step post, learn how to use InfluxDB as a Grafana data source to monitor the difference of a value over time.
Read more
With the new 'No basic role' in Grafana, you'll improve access control and the overall security of your Grafana instance.
Read more
OpenTelemetry users often push logs, metrics, and traces to a collector before sending them to their backend. Find out why this is such a popular...
Read more
Learn why observability is critical to CI/CD and how we're addressing it internally at Grafana Labs, and get a sneak peek at our vision for something...
Read more
From AI to real user monitoring, these on-demand ObservabilityCON 2023 sessions dive into the latest tools, strategies, and best practices in the...
Read more
We're all-in on OpenTelemetry at Grafana Labs, which is why we are excited to announce the public preview of the Grafana OpenTelemetry distribution...
Read more
We're all-in on OpenTelemetry at Grafana Labs, which is why we are excited to announce the public preview of the Grafana OpenTelemetry distributions...
Read more
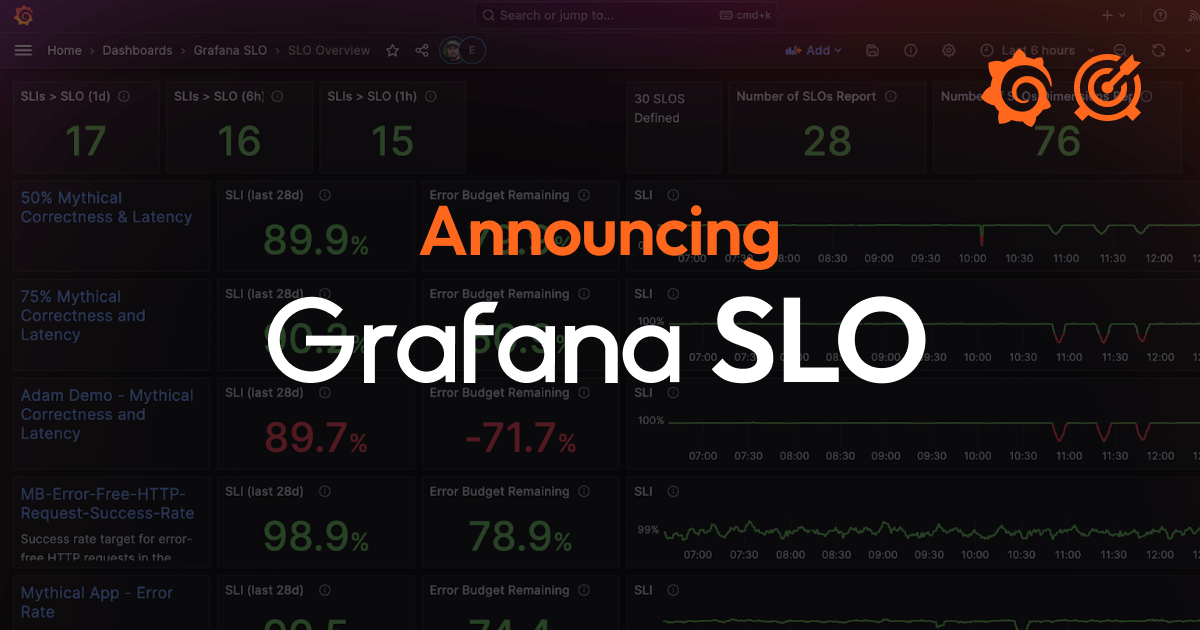
Grafana SLO makes it easy to create, manage, and scale service level objectives, SLO dashboards, and error budget alerts in Grafana Cloud.
Read more
Grafana Cloud Application Observability provides a curated solution that makes it easier to get started with monitoring application performance and...
Read more
Grafana Cloud brings you new and improved cost management features for your metrics, logs, and monthly bills.
Read more
Learn how we switched from Cluster Autoscaler to Karpenter to more efficiently manage Kubernetes autoscaling on AWS.
Read more
The redesigned panel headers we rolled out earlier this year help accommodate the wide range of Grafana use cases that have emerged over the years.
Read more
Through a well-organized set of design elements, patterns, and guidelines, Saga establishes a shared visual language for all of Grafana Labs’...
Read more
Learn how the Grafana Labs engineering team upgraded Grafana Cloud databases to MySQL 8 using an incremental, staged approach that resulted in little...
Read more