5 useful transformations you should know to get the most out of Grafana
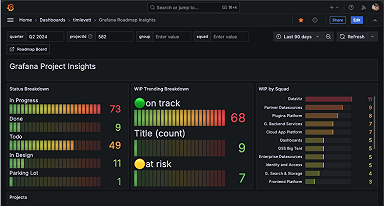
Grafana Labs Engineering Director Tim Levett shares his top five transformations for better understanding data in Grafana.
Read more
Grafana Labs Engineering Director Tim Levett shares his top five transformations for better understanding data in Grafana.
Read more
The latest release of Grafana Tempo introduces a new Parquet storage format, gRPC streaming formats on the frontend, and additional TraceQL metrics...
Read more
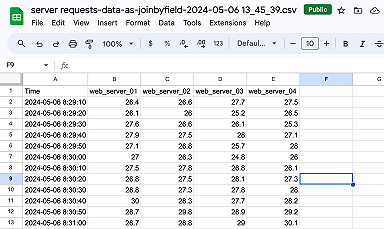
In this step-by-step blog post, learn how to get CSV data from any Grafana visualization into popular spreadsheet applications like Microsoft Excel or...
Read more
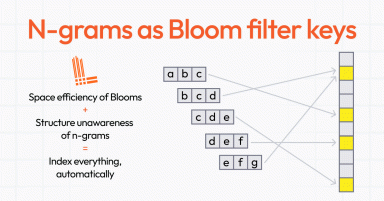
Learn how we're using Bloom filters in Grafana Loki to improve users' experience with faster-returning filter queries, while still keeping Loki easy...
Read more
With this new feature, available now in Grafana Cloud, alerts flow from Grafana OnCall into ServiceNow and vice-versa, helping to keep incident...
Read more
Learn how to collect and analyze telemetry data from Google Cloud Run using OpenTelemetry and Application Observability in Grafana Cloud.
Read more
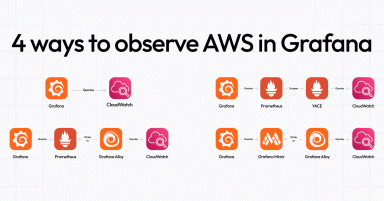
There are four ways to monitor AWS metrics in Grafana. Find out which one best fits your needs with this handy guide.
Read more
Learn how to use Grafana Beyla in Grafana Alloy to get RED metrics from your running services, as well as instrument your apps automatically in...
Read more
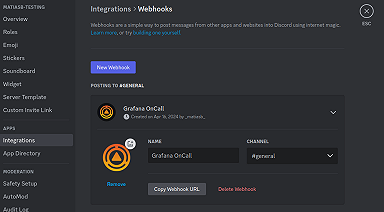
Learn how to set up alert group notifications in Grafana OnCall for two popular third-party ChatOps tools, Mattermost and Discord.
Read more
Catch up on all the latest and greatest features released this month in our fully managed Grafana Cloud observability platform.
Read more
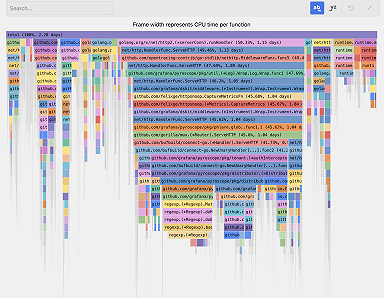
Flame graph AI in Grafana Cloud uses a large-language model to assist with flame graph data interpretation so you can identify bottlenecks, root...
Read more
Learn how to build custom visualizations in Grafana with the all the latest Canvas panel features
Read more
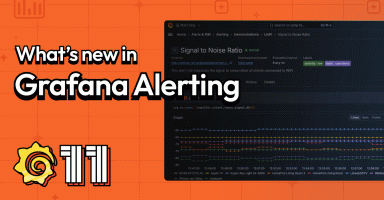
Improve your incident response with the latest updates to Grafana Alerting, including simplified routing, performance improvements, consolidated...
Read more
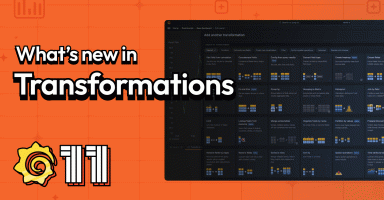
Find out how Grafana 11 makes it easier to browse, filter, and choose which transformations will be the most helpful for the outcomes you need and the...
Read more
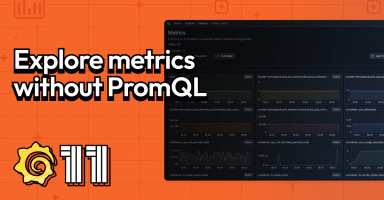
Grafana 11 introduces a queryless experience that allows you to browse metrics, identify anomalies, and uncover insights with just a few clicks — and...
Read more
