How to monitor your favorite YouTube channels in Grafana
Learn how to set up a Grafana dashboard so you don't miss updates from the YouTubers you love.
Read more
Learn how to set up a Grafana dashboard so you don't miss updates from the YouTubers you love.
Read more
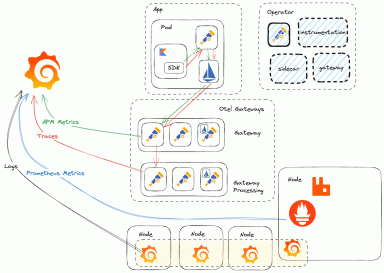
ComplyAdvantage has used OpenTelemetry and Grafana Cloud to continually advance its observability strategy and make it more flexible.
Read more
The Prometheus community continues to deepen its commitment to the OpenTelemetry project. Here’s what’s in store for this year.
Read more
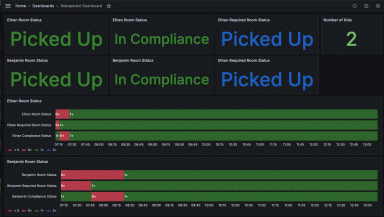
Motivating kids to clean their rooms — and keeping tabs on their progress — can be a challenge. Here’s how to make things a little easier with Grafana...
Read more
Learn how some of the world's biggest shipping and logistics companies use the Grafana LGTM Stack to ensure the best possible customer experience.
Read more
Headed to KubeCon Europe? Check out all the sessions featuring Grafanistas and find out how to meet with members of the Grafana Labs team in Paris.
Read more
Join us at GrafanaCON 2024 to learn about the latest major release of Grafana, explore cool use cases in the community, connect with peers, and more.
Read more
Voting is now open for the Golden Grot Awards, which recognize the very best Grafana dashboards. Pick your favorite personal and professional...
Read more
With a free Grafana Cloud account and a VPN service, you can ensure your network is secure by receiving real time alerts.
Read more
With a sponsored Grafana Cloud Pro account, the OSS project maintainers for Caddy server accelerated root cause analysis, reduced MTTR, and more.
Read more
Registration for GrafanaCON 2024, our biggest community event of the year, is officially open. Join us live and in person in Amsterdam this April!
Read more
Your guide to finding and connecting with Grafana Labs at the prominent open source conference in Brussels.
Read more
From cost optimization to improved reliability, here are some of the biggest reasons companies choose to migrate to Grafana Cloud to manage and...
Read more
With Grafana Labs’ Observability Journey Maturity Model, organizations can identify strengths — and opportunities for growth — within their...
Read more
See how TeleTracking combined Prometheus and Grafana Cloud to give its users greater visibility into their services, lower overhead, and serve as key...
Read more
