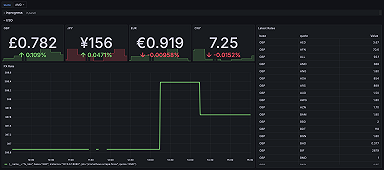
Observing exchange rates: How to keep tabs on currencies during the summer travel season
Discover how to use Grafana to track changes in foreign exchange rates so your money goes further when you travel.
Read more
Discover how to use Grafana to track changes in foreign exchange rates so your money goes further when you travel.
Read more
Check out the agenda for ObservabilityCON 2024, a two-day conference kicking off in New York City on Sept. 24. Participate in hands-on sessions and...
Read more
There are lots of ways to deploy Grafana Loki, but the Grafana Ansible collection might be the right choice if you're just starting out. Find out how...
Read more
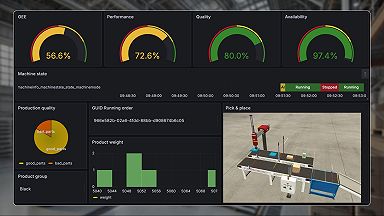
Grafana is a core component of UMH’s open source IIoT platform, helping users visualize key metrics like temperature and overall equipment...
Read more
Registration is now live for ObservabilityCON 2024, our flagship observability event, taking place September 24-25 in New York City.
Read more
Reduce the time it takes for a developer to become aware of a bug and its source once it's introduced.
Read more
How Dell successfully migrated to Grafana Cloud and consolidated its observability in the process
Read more
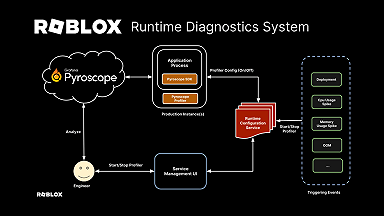
With Grafana Pyroscope and on-demand profiling, Roblox can provide a reliable experience for more than 70 million active users across the globe.
Read more
From creating a detailed README file to using our plugin validator tool, here are six tips to prepare your Grafana plugin for our review and...
Read more
Ruben Fernandez is one of the winners of the 2024 Golden Grot Awards! Find out how his Grafana dashboard plays a central role in his morning commute.
Read more
Christopher Field is one of the winners of the 2024 Golden Grot Awards. Find out why his win is a testament to all the non-traditional use cases for...
Read more
ObservabilityCON, our flagship open source observability event, is coming to New York City this September.
Read more
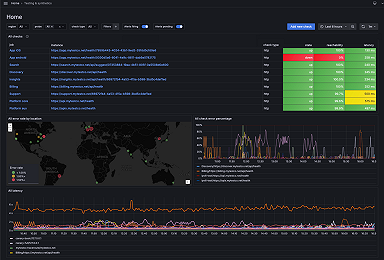
Learn how Synthetic Monitoring, powered by Grafana k6, creates multi-step synthetics to simulate complex transactions and end-user journeys.
Read more
Weren’t able to join us in person at GrafanaCON 2024? You can now catch up on all the exciting announcements and user stories with our on-demand...
Read more
With our GrafanaCON 2024 Keynote Recap webinars, you can catch up on all the big news out of GrafanaCON this year – including the release of Grafana...
Read more

