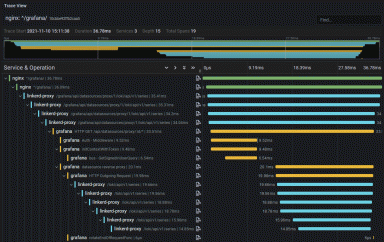
Configuring Grafana Tempo and Linkerd for distributed tracing
A guide to collecting traces using Grafana Tempo, Grafana, NGINX Ingress Controller, and Linkerd.
Read more
A guide to collecting traces using Grafana Tempo, Grafana, NGINX Ingress Controller, and Linkerd.
Read more
How one technology company built an effective end-to-end observability solution within weeks with Grafana Cloud.
Read more
Join us in January as Grafana Labs experts host webinars on distributed tracing and demo our new Sentry plugin.
Read more
How a cloud native service provider uses Promtail, Grafana, and Grafana Loki for Kubernetes logging at scale.
Read more
Learn how observability helped one company develop a data-driven mindset that saved time and increased efficiency.
Read more
Grafana Labs brought together the EMEA community to discuss observability, monitoring, and load testing.
Read more
Learn how Ocrolus, a fintech automation platform, used existing industry tooling and knowledge to capture meaningful data from its nearly 1,000...
Read more
Grafana Labs will host free webinars in December with experts sharing tips on how to effectively use the Grafana Stack, Grafana Enterprise, and...
Read more
Read more
How we can use experimental observations and developer narratives as effective storytelling techniques to produce a prediction.
Read more
Join Grafana Labs' virtual meetups: Learn about monitoring with Grafana Cloud and AWS, best practices in Loki, and load testing with k6
Read more
How Vonage shifted its observability left, using k6 and Grafana to build cost-effective performance testing in its CI pipeline.
Read more
Learn how Kambi migrated from a poorly dimensioned in-house, on-prem Graphite solution to Grafana Cloud.
Read more
How Network to Code uses Grafana to visualize and predict the probability of a security breach in IoT devices.
Read more
Experts from Snyk, Citibank, and TripAdvisor look at the big observability trends shaping the space now and in the future.
Read more
