GrafanaCONline 2022: First look at this year's lineup
More than 40 speakers from Grafana's global community will share their insights, best practices, and of course, dashboards.
Read more
Products
Grafana Cloud
Monitor, analyze, and act faster with AI-powered observability.
LGTM+ Stack
Key Capabilities
Observability Solutions
end-to-end integrations
Opinionated integrations that help you get there easier and faster
monitor infrastructure
Out-of-the-box KPIs, dashboards, and alerts for observability
visualize any data
Instantly connect all your data sources to Grafana
Grafana Cloud
Monitor, analyze, and act faster with AI-powered observability.
The actually useful free plan
10k series Prometheus metrics
50GB logs, 50GB traces, 50GB profiles
500VUh k6 testing
20+ Enterprise data source plugins
100+ pre-built solutions
3 active AI users
Opinionated integrations that help you get there easier and faster
Instantly connect all your data sources to Grafana
Getting started with managing your metrics, logs, and traces using Grafana
Learn how to unify, correlate, and visualize data with dashboards using Grafana.
More than 40 speakers from Grafana's global community will share their insights, best practices, and of course, dashboards.
Read more
A new "Grafana's Big Tent" podcast episode reveals how SLOs have shaped Grafana Cloud and the business of observability.
Read more
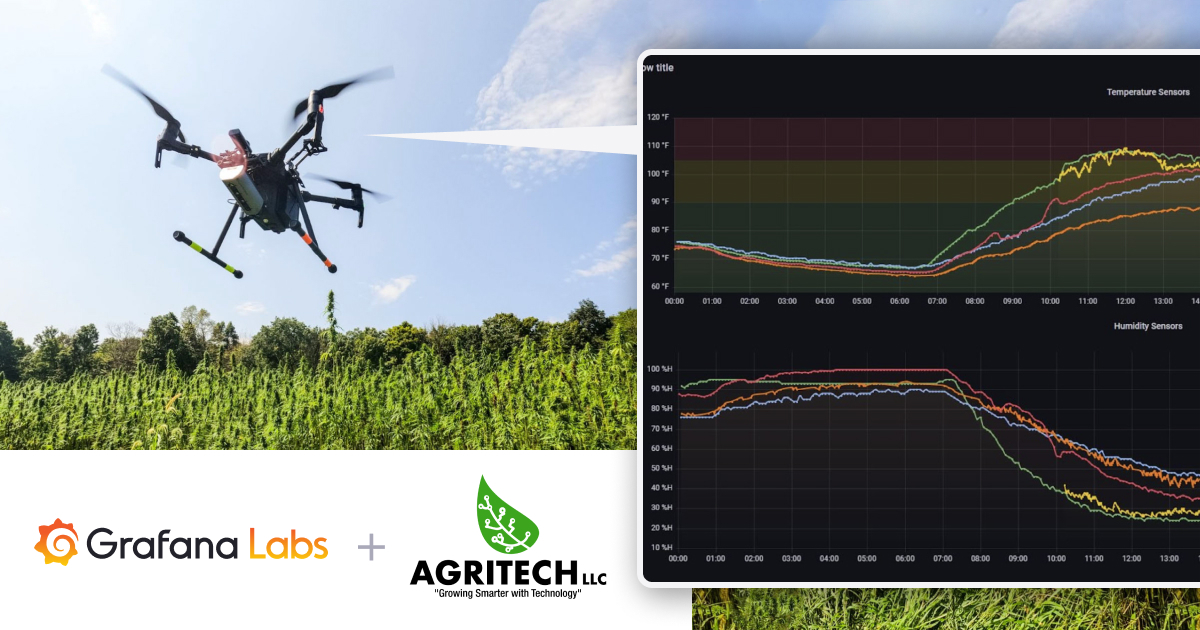
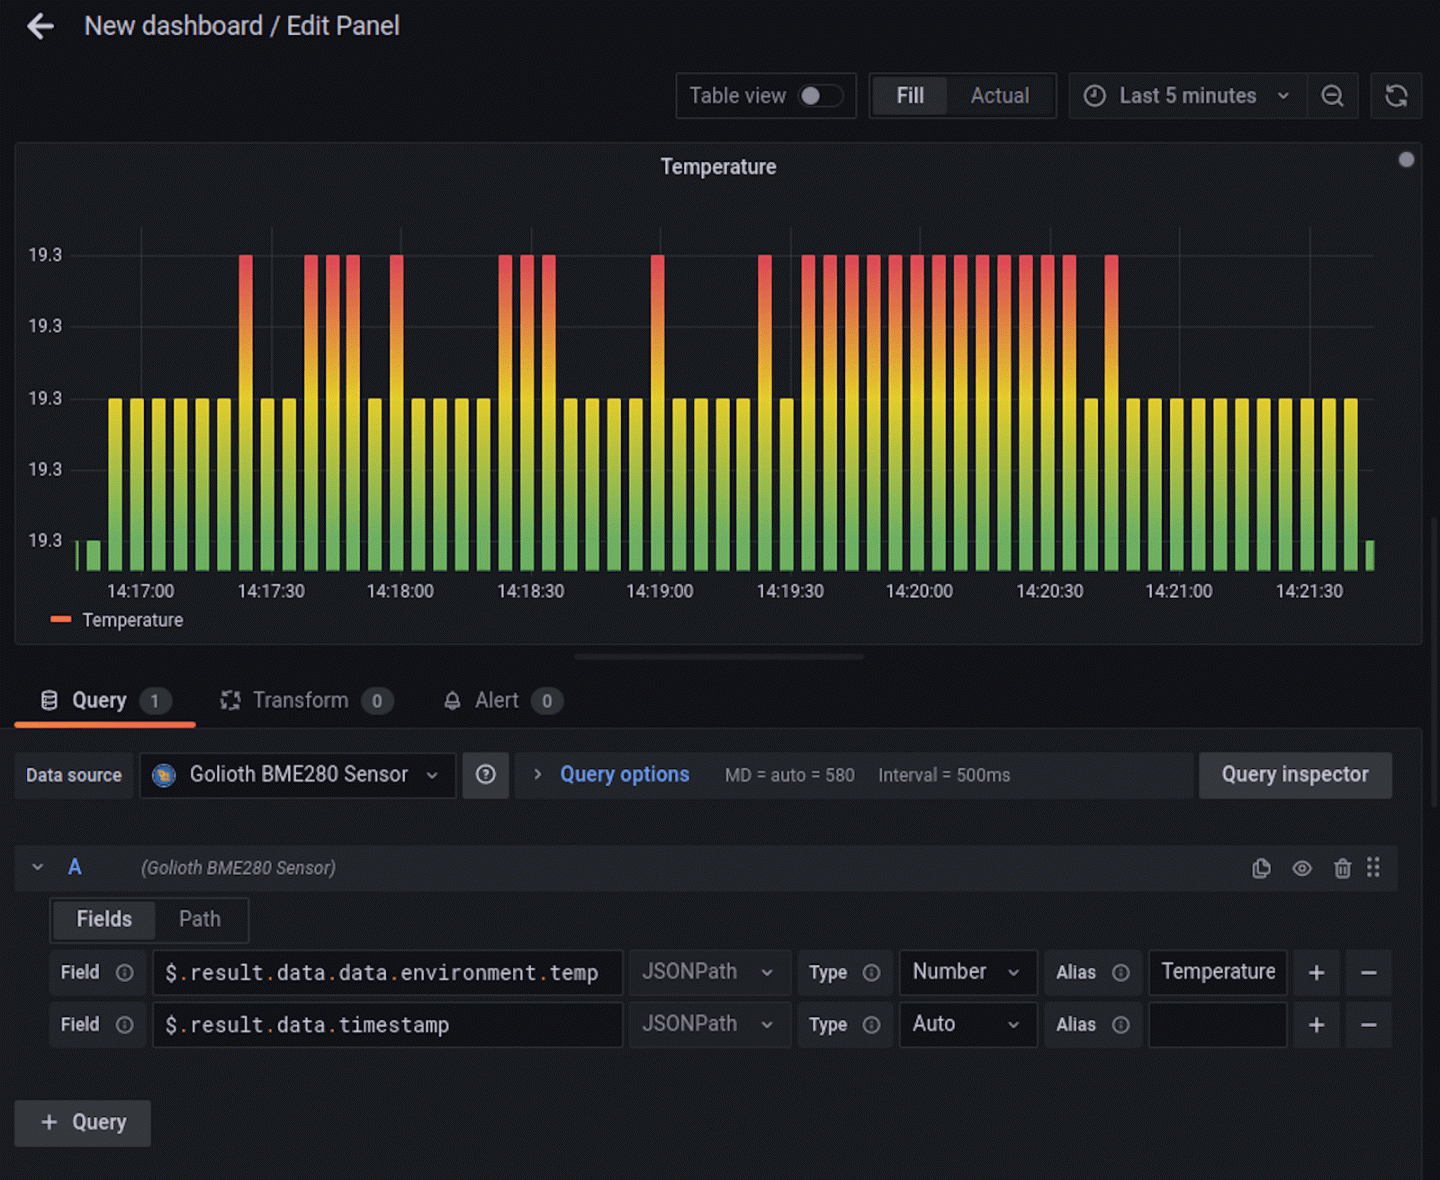
One man's personal garden bot helped inspire a business that uses Grafana to monitor data that is revolutionizing farming and increasing yields.
Read more
With the WebSockets plugin, you can use a Grafana panel to get immediate feedback on the health of your devices.
Read more
Grafana Labs experts will host live weekly webinars in the Asia Pacific time zone to walk through the latest Grafana features and improve your...
Read more
At GrafanaCONline 2022, share your incredible stories — and dashboards — with the Grafana community.
Read more
Read more
Grafana Labs hosts free webinars that will showcase Grafana Loki, Grafana Enterprise Traces, Grafana OnCall, and some of the latest features in...
Read more
Learn how Grafana Loki, Grafana Tempo, and Grafana have saved the blockchain gaming studio time (and headaches), allows for proactive problem-solving,...
Read more
Grafana k6 launched k6 Cloud for Education, a program that includes a free k6 Cloud account to help teach performance testing.
Read more
In our February webinars, Grafana Labs pros provide the basics and best practices for observability, on-call management, distributed tracing, and...
Read more
You can uncover new business opportunities by turning your logs into metrics with Istio and Grafana Cloud.
Read more
How to build a high availability observability stack across multiple data centers with Consul, Prometheus, Grafana Loki, Grafana Tempo, and...
Read more
How the U.S. Department of Defense runs Grafana, Grafana Enterprise, and Grafana Loki to collect telemetry on a granular and global level.
Read more
Grafana Labs Engineering Director Mat Ryer shares some of his favorite moments from hosting GopherCon UK.
Read more