Grafana Labs OSS projects: Discover the latest and greatest features and updates
Read more
Products
Grafana Cloud
Monitor, analyze, and act faster with AI-powered observability.
LGTM+ Stack
Key Capabilities
Observability Solutions
end-to-end integrations
Opinionated integrations that help you get there easier and faster
monitor infrastructure
Out-of-the-box KPIs, dashboards, and alerts for observability
visualize any data
Instantly connect all your data sources to Grafana
Grafana Cloud
Monitor, analyze, and act faster with AI-powered observability.
The actually useful free plan
10k series Prometheus metrics
50GB logs, 50GB traces, 50GB profiles
500VUh k6 testing
20+ Enterprise data source plugins
100+ pre-built solutions
3 active AI users
Opinionated integrations that help you get there easier and faster
Instantly connect all your data sources to Grafana
Getting started with managing your metrics, logs, and traces using Grafana
Learn how to unify, correlate, and visualize data with dashboards using Grafana.
Read more
Read more
Read more
Read more
Read more
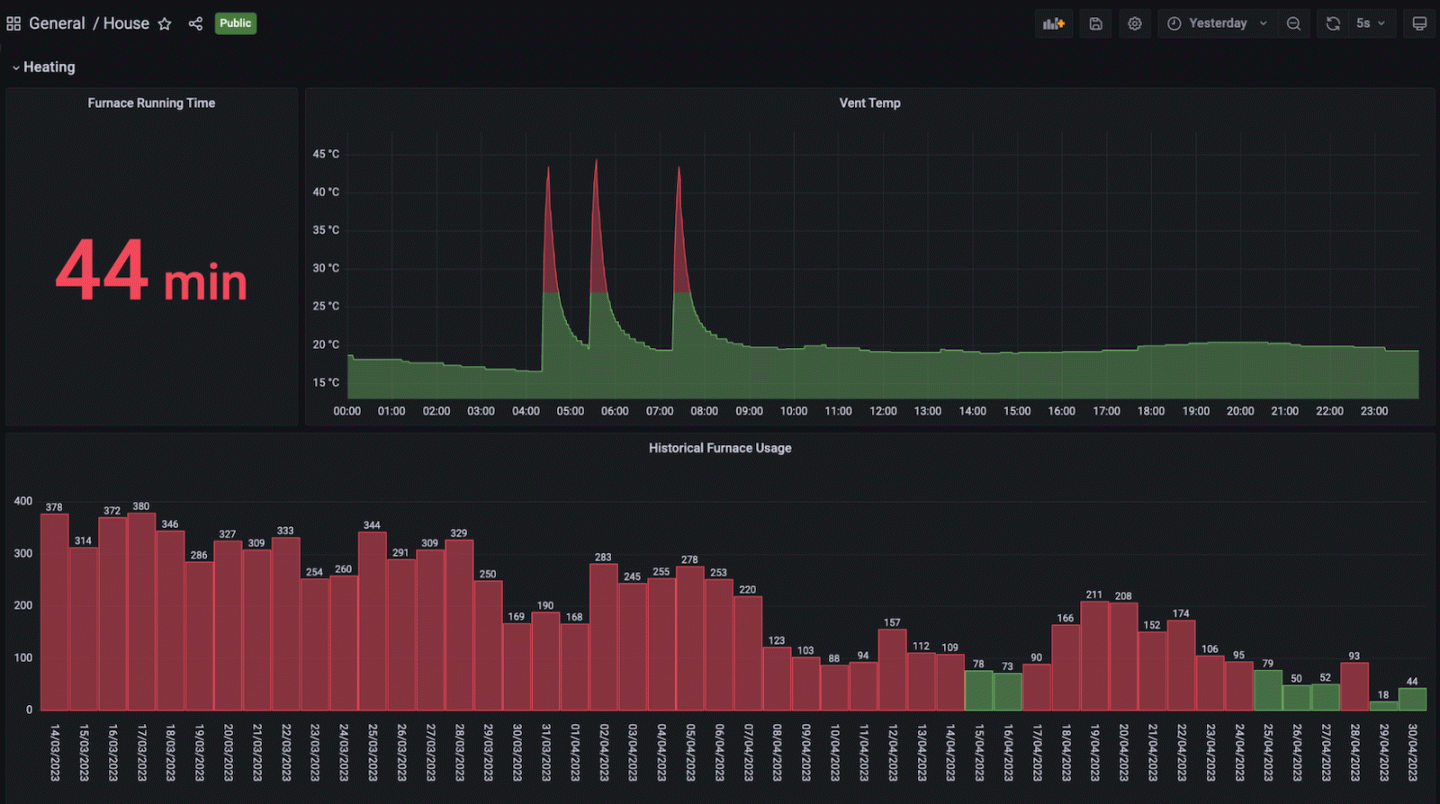
Whether you want to monitor a home thermostat or your training regimen, get inspired to kick off your next homelab project with these GrafanaCON 2023...
Read more
Read more
Read more
Read more
Read more
Read more
Read more
Read more
Read more
Visualizing xDSL metrics on a Grafana dashboard makes it easy to figure out the cause of short-term internet outages.
Read more