Introducing the Grafana Champions Program: celebrating our open source community
The new Grafana Champions Program recognizes and celebrates those who make a difference in the Grafana open source community.
Read more
Products
Grafana Cloud
Monitor, analyze, and act faster with AI-powered observability.
LGTM+ Stack
Key Capabilities
Observability Solutions
end-to-end integrations
Opinionated integrations that help you get there easier and faster
monitor infrastructure
Out-of-the-box KPIs, dashboards, and alerts for observability
visualize any data
Instantly connect all your data sources to Grafana
Grafana Cloud
Monitor, analyze, and act faster with AI-powered observability.
The actually useful free plan
10k series Prometheus metrics
50GB logs, 50GB traces, 50GB profiles
500VUh k6 testing
20+ Enterprise data source plugins
100+ pre-built solutions
3 active AI users
Opinionated integrations that help you get there easier and faster
Instantly connect all your data sources to Grafana
Getting started with managing your metrics, logs, and traces using Grafana
Learn how to unify, correlate, and visualize data with dashboards using Grafana.
The new Grafana Champions Program recognizes and celebrates those who make a difference in the Grafana open source community.
Read more
Find out how DHL Switzerland radically transformed their stack to reduce MTTR and make a smooth migration to the public cloud.
Read more
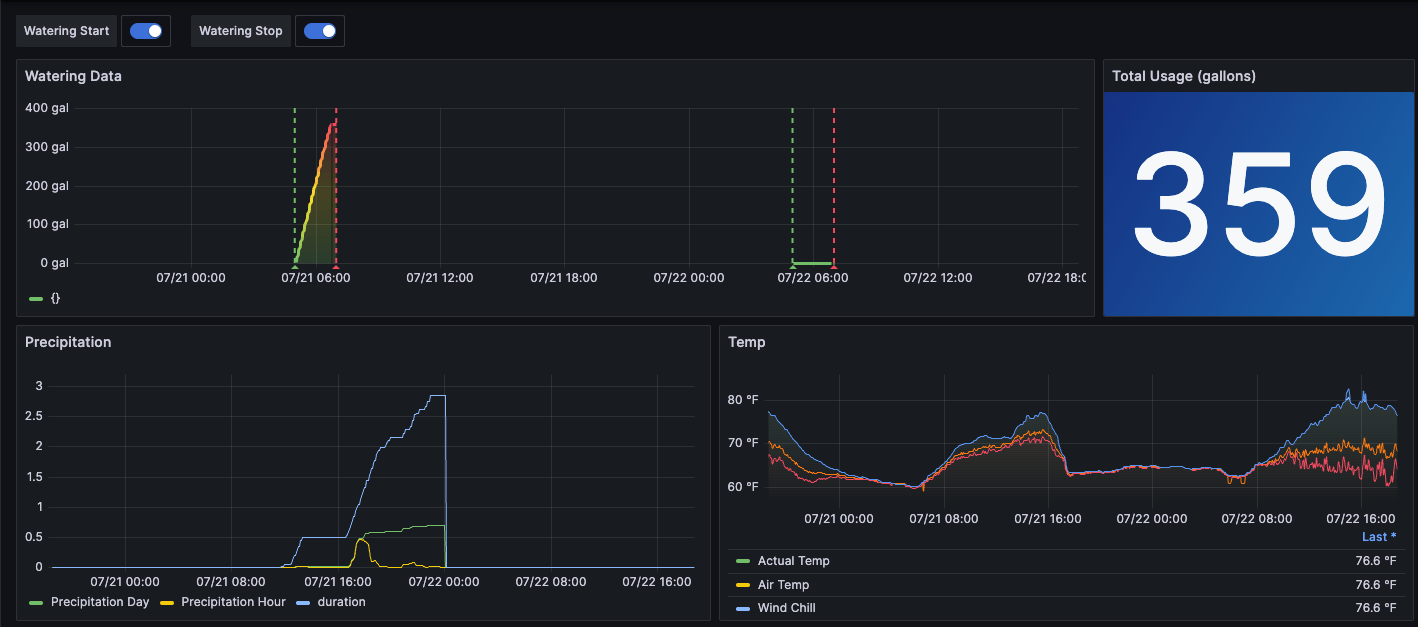
Follow along to learn how you can pair Grafana with mechanical and smart devices to help ensure your pool volume stays where it needs to be, rain or...
Read more
A switch from Elasticsearch to Grafana Loki let a company stay on top of networking incidents and search through hundreds of gigabytes of logs in...
Read more
Grafana Golden Grot Award finalists explain how they created a beautiful and informative Grafana dashboard to observe science experiments.
Read more
Grafana Cloud Free is the best way to run our software and understand its full capabilities.
Read more
The new Tempo operator can create and manage all required objects, expose metrics, and support upgrading the Tempo instance in a Kubernetes cluster.
Read more
The global payment service provider values Grafana Enterprise for its flexibility, scalability, and its ability "to reinvent itself."
Read more
Learn why Ultimate, which operates an AI-driven customer support automation platform, moved to Grafana Cloud for IRM and how those efforts were...
Read more
Read more
Read more
The excitement around Grafana 10 continued throughout the second full day of sessions at GrafanaCON 2023.
Read more
The first full day of GrafanaCON 2023 kicked off with the release of Grafana 10, and celebrated unique Grafana use cases from the community.
Read more
The countdown to GrafanaCON 2023 has officially begun! Follow these tips and best practices to get the most out of the virtual event.
Read more
At GrafanaCON 2023 Local Meetups, attendees have an opportunity to learn more about Grafana 10, as well as network with local Grafana community...
Read more