Join Grafana Labs for the 10th Hacktoberfest!
Join the open source extravaganza! Connect with the global open source community, improve your skills, and make a lasting impact on projects you're...
Read more
Join the open source extravaganza! Connect with the global open source community, improve your skills, and make a lasting impact on projects you're...
Read more
Grafana users from Sky, Actian, and more will share their observability wins — and how they got there — at ObservabilityCON 2023.
Read more
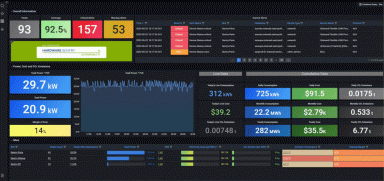
Sentry Software ditched its legacy electricity monitoring solutions and safely reduced data center energy usage by 19% with Hardware Sentry, Grafana,...
Read more
They span across land, sea, space, and virtual worlds. Check out some of the most memorable Grafana dashboards from the past decade.
Read more
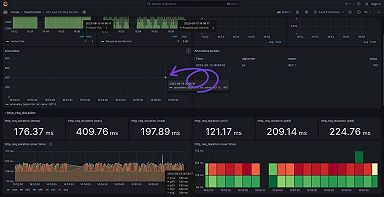
The xk6-anomaly extension makes the analysis of test results faster and more precise, improves the efficiency of problem detection, and simply saves...
Read more
How Daimler Truck uses Grafana, Loki, Prometheus, and Pyrra to maximize uptime and minimize latency for their connected vehicle service.
Read more
Grafana has been a game-changer for a group of universities looking for a secure and customizable solution for monitoring digital archives.
Read more
While it definitely takes some courage, learning in public is a great way to benefit from — and contribute back to — an open source community.
Read more
Registration is live for ObservabilityCON 2023! Here's a preview of this year's exciting agenda for our premier open source observability event.
Read more
Replacing PagerDuty with Grafana's Incident Response and Management suite was a simple decision once Prezi compared the tools' costs, features, and...
Read more
Join us in London at ObservabilityCON 2023 to hear success stories from the open source observability community — and maybe share your own!
Read more
In OSS communities, good reply game entails so much more than a simple response to a technical question. It fosters the meaningful exchanges and...
Read more
Trust and transparency are essential building blocks for any community — including those that flourish around open source software like Grafana.
Read more
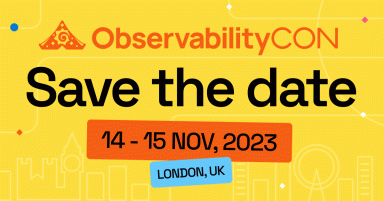
Mark your calendar for ObservabilityCON 2023, taking place 14-15 November in London. It’s the premier, in-person observability conference you don’t...
Read more
Learn how Grafana and ClearML simplify the process of managing and monitoring machine learning models in production, and help developers quickly...
Read more
