GrafanaCON 2024: In April, in Amsterdam, and in person!
GrafanaCON is back in Amsterdam and back in person! Learn more about our biggest community event of the year.
Read more
Products
Grafana Cloud
Monitor, analyze, and act faster with AI-powered observability.
LGTM+ Stack
Key Capabilities
Observability Solutions
end-to-end integrations
Opinionated integrations that help you get there easier and faster
monitor infrastructure
Out-of-the-box KPIs, dashboards, and alerts for observability
visualize any data
Instantly connect all your data sources to Grafana
Grafana Cloud
Monitor, analyze, and act faster with AI-powered observability.
The actually useful free plan
10k series Prometheus metrics
50GB logs, 50GB traces, 50GB profiles
500VUh k6 testing
20+ Enterprise data source plugins
100+ pre-built solutions
3 active AI users
Opinionated integrations that help you get there easier and faster
Instantly connect all your data sources to Grafana
Getting started with managing your metrics, logs, and traces using Grafana
Learn how to unify, correlate, and visualize data with dashboards using Grafana.
GrafanaCON is back in Amsterdam and back in person! Learn more about our biggest community event of the year.
Read more
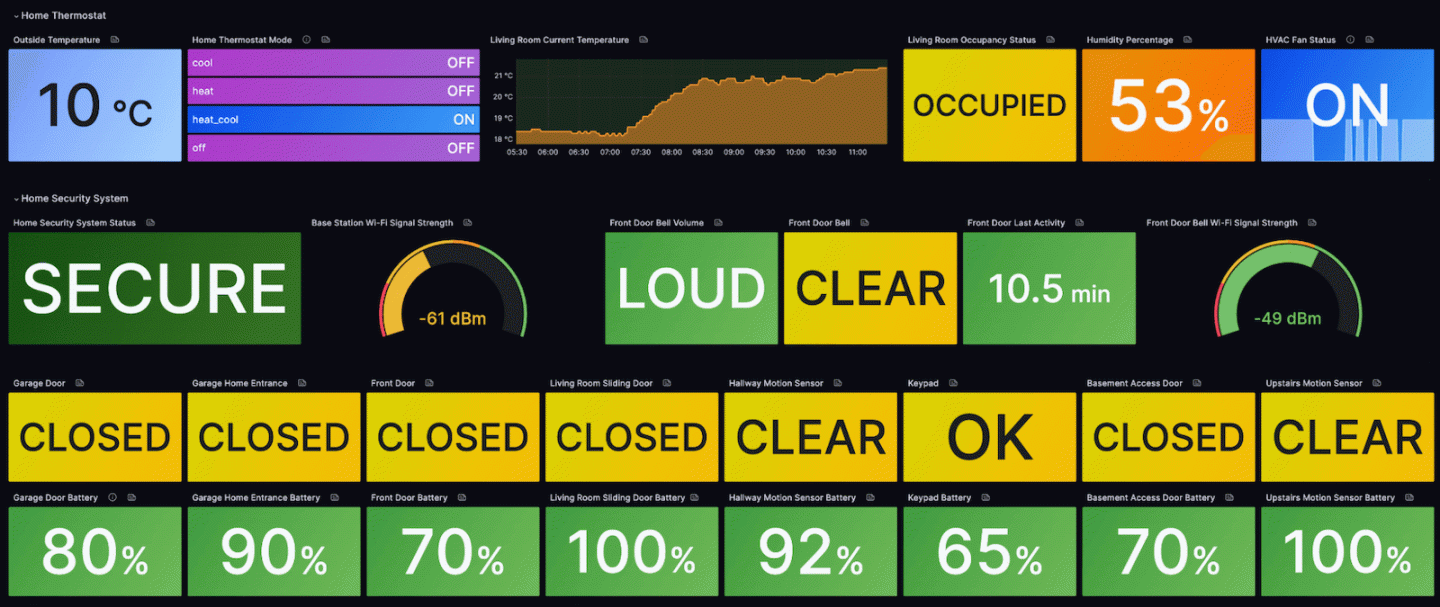
Find out how to use Grafana Cloud to visualize and monitor your home with smart devices.
Read more
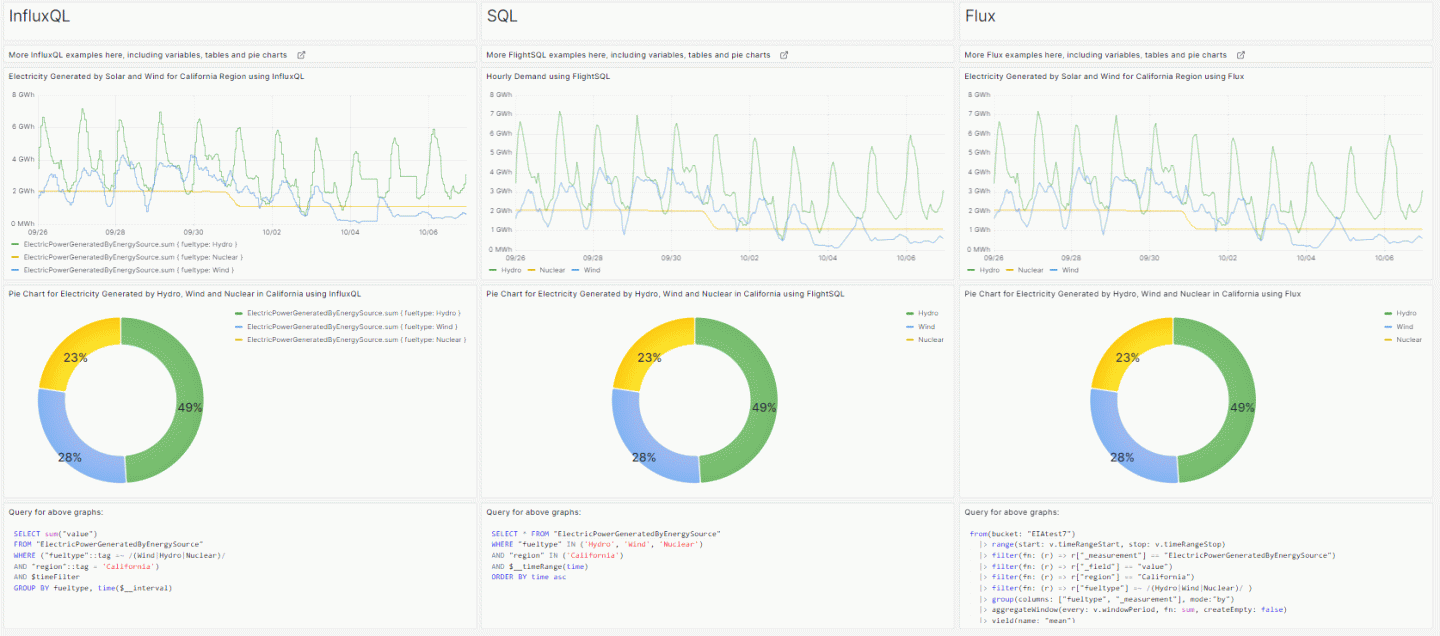
Before getting started with InfluxDB and Grafana — a powerful duo for data management and visualization — you need to choose between three query...
Read more
How Grafana community members are using their dashboards for projects at work and at home
Read more
From major releases to new projects like Grafana Beyla and Grafana Pyroscope, 2023 was a big year for OSS projects, and the open source community,...
Read more
Grafana 10! Pyroscope! Beyla! It was a year of celebrating milestones, launching new projects, and honoring the community.
Read more
Heading to AWS re:Invent 2023? Swing by our booth to watch live demos, get some Grafana swag, and chat with our observability experts.
Read more
Whether you’re attending in person or plan to join us virtually for the keynote, here are some helpful details to get ready for ObservabilityCON 2023.
Read more
Through a well-organized set of design elements, patterns, and guidelines, Saga establishes a shared visual language for all of Grafana Labs’...
Read more
Want to learn more about the latest trends in open source observability? Be sure to sign up for the livestream of the ObservabilityCON 2023 opening...
Read more
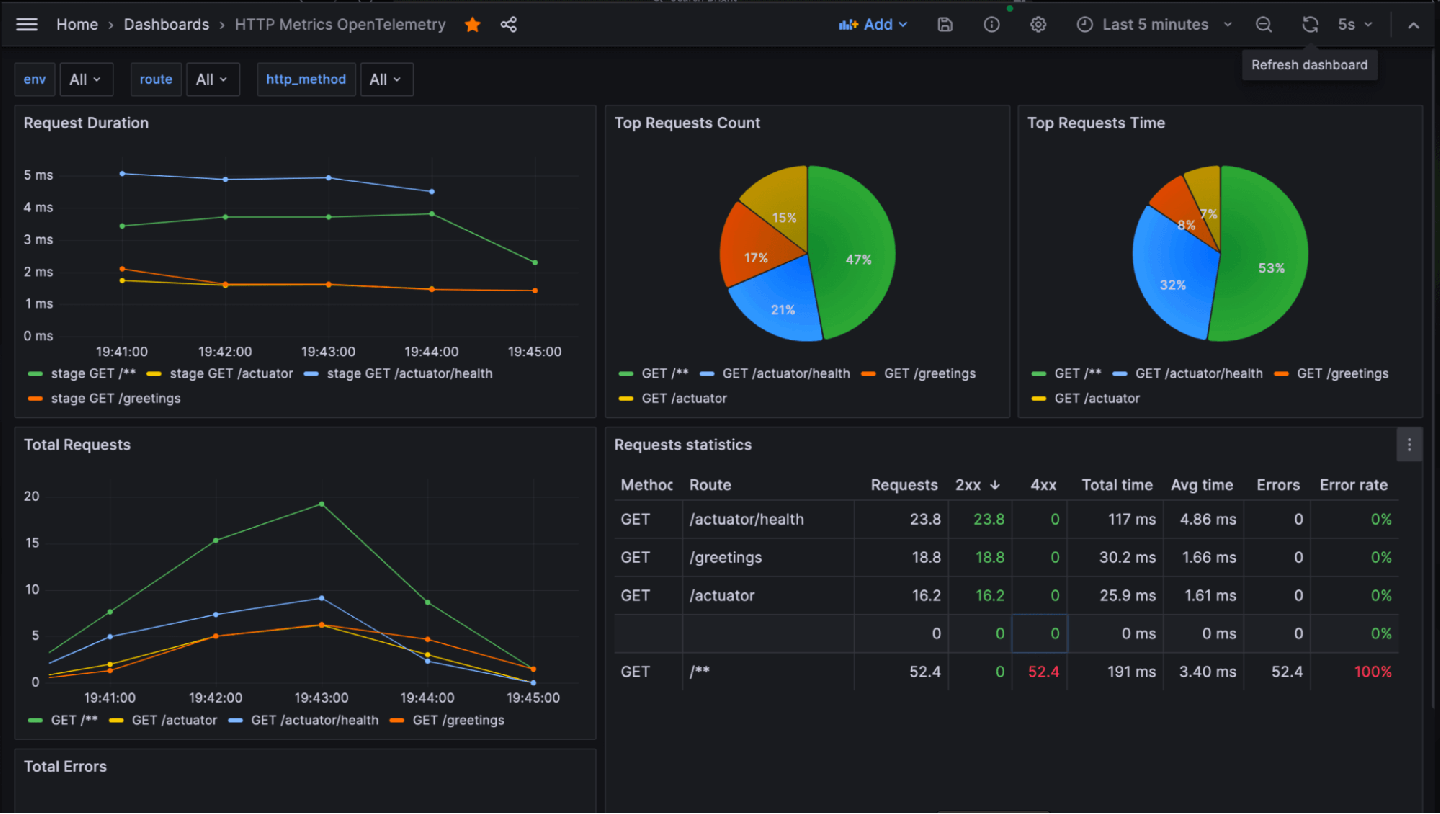
Learn how to integrate a Spring Boot application with Grafana using OpenTelemetry standards. And follow along by checking out practical examples in...
Read more
At KubeCon + CloudNativeCon North America, be sure to check out these four sessions featuring Grafana Labs experts and visit us at booth C18!
Read more
The all-new Grafana developer portal is a central hub of curated resources for developers who want to extend Grafana's capabilities.
Read more
When winter is coming, Flexcity isn't worried because they have Grafana Cloud to visualize and monitor real-time energy consumption.
Read more
The contributions we’ve seen from the Grafana open source community over the years have been both impressive and inspiring — and we know we’re just...
Read more