Grafana Cloud Synthetic Monitoring: How to simulate user journeys to ensure the best possible...
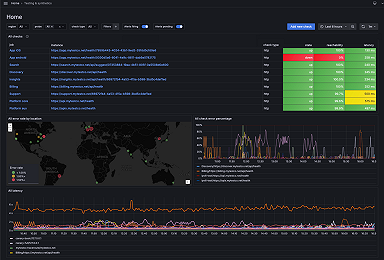
Learn how Synthetic Monitoring, powered by Grafana k6, creates multi-step synthetics to simulate complex transactions and end-user journeys.
Read more
Dashboards in the wild, interesting use cases, and learnings from the community
Featured community posts
Learn how Synthetic Monitoring, powered by Grafana k6, creates multi-step synthetics to simulate complex transactions and end-user journeys.
Read more
Learn how to set up a Grafana dashboard so you don't miss updates from the YouTubers you love.
Read more
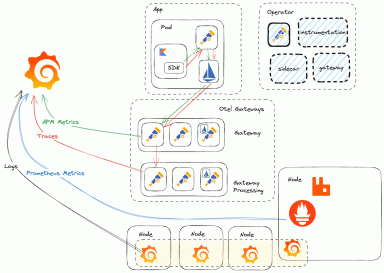
ComplyAdvantage has used OpenTelemetry and Grafana Cloud to continually advance its observability strategy and make it more flexible.
Read more
If you weren’t able to join us in person, you can now catch up on all the latest announcements, OSS updates, and inspiring community use cases from...
Read more
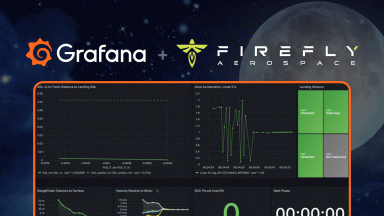
Behind Blue Ghost Mission 1 — the first fully successful lunar landing by a commercial provider — there was a team of skilled engineers, years of...
Read more
We’re excited to share that ObservabilityCON, our flagship observability event, will take place in London this October.
Read more
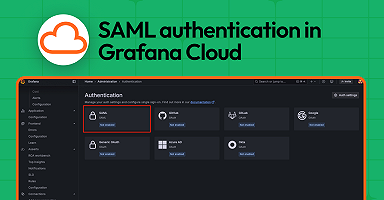
SAML authentication in Grafana Cloud: a guide for easy configuration
Read more
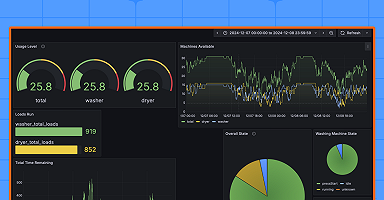
Using TimescaleDB and Grafana, Dakota and Cole — two students, friends, and data enthusiasts — built an observability solution to make laundry days in...
Read more
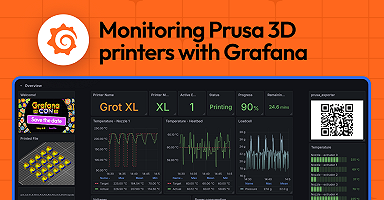
Have you ever thought about observing 3D printers? With prusa_exporter you can build your Prusa printer metrics and visualize everything you want to...
Read more
We’re excited to share that we’ve made the initial code drop of Grafana Beyla to OpenTelemetry, under the new project name OpenTelemetry eBPF...
Read more
Causely users can now connect directly to their Grafana dashboards for faster root cause analysis.
Read more
Find out how the online travel platform shifted from multiple observability solutions to a single, unified platform.
Read more
Counting down the days to GrafanaCON 2025? We are too. Here’s everything you need to know to make the most out of your GrafanaCON experience.
Read more
No green thumb? No problem. Here's a simple IoT project to visualize the health of your plants using Arduino, Prometheus, and Grafana Cloud.
Read more
Find out how putting business data in dashboards and using Adaptive Metrics helped the team behind Cookidoo spot errors and save on costs.
Read more
Through standardized tagging and a migration to Grafana Cloud, the SpotOn engineering team transformed its observability strategy, ditching complexity...
Read more
Headed to Google Cloud Next 2025? Swing by our booth or set up a meeting to talk with our observability experts and get some fun Grafana Labs swag!
Read more
Our half-day GrafanaCON Local events bring all the excitement from GrafanaCON 2025, including technical deep dives, user stories, and our Ask the...
Read more
