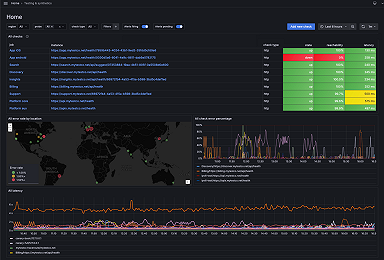
Grafana Cloud Synthetic Monitoring: How to simulate user journeys to ensure the best possible...
Learn how Synthetic Monitoring, powered by Grafana k6, creates multi-step synthetics to simulate complex transactions and end-user journeys.
Read more
Dashboards in the wild, interesting use cases, and learnings from the community
Featured community posts
Learn how Synthetic Monitoring, powered by Grafana k6, creates multi-step synthetics to simulate complex transactions and end-user journeys.
Read more
Learn how to set up a Grafana dashboard so you don't miss updates from the YouTubers you love.
Read more
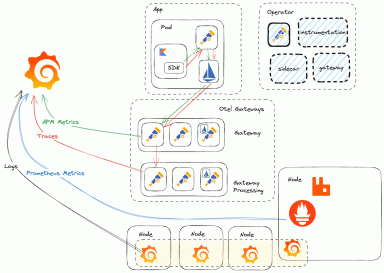
ComplyAdvantage has used OpenTelemetry and Grafana Cloud to continually advance its observability strategy and make it more flexible.
Read more
We’re excited to kick off season 3 of “Grafana’s Big Tent,” our award-winning podcast about the people, community, technology, and tools shaping...
Read more
It’s official: GrafanaCON, our biggest community event of the year, will take place 20-22 April, 2026 in Barcelona. Can’t wait to see you there!
Read more
Register today for ObservabilityCON on the Road, a one-day version of our flagship observability event that we’re bringing to a city near you in 2026.
Read more
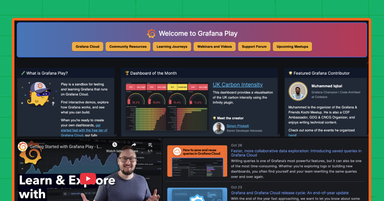
By highlighting community contributions and making Grafana’s features easier to explore, the redesigned Grafana Play homepage invites everyone — from...
Read more
Nerd out with our Star Wars-themed dashboard and all its nods to a galaxy far, far away. Plus, get some tips to make your next dashboard is the chosen...
Read more
See how a Grafana-focused hackathon helped Geotab's engineers build the newest iteration of their observability platform, and get some tips you can...
Read more
Meet us at KubeCon North America 2025! Our observability experts are participating in multiple sessions throughout the week, and you can find us at...
Read more
Want an easy way to calculate the real-time financial costs of a meeting, one second (and one buzzword) at a time? There’s a Grafana dashboard for...
Read more
See how SpotOn is using Grafana Labs' context-aware AI agent for faster onboarding, better adoption, and simpler troubleshooting.
Read more
How a simple AWS Lambda function transforms GitLab pipeline visibility using Grafana Cloud Logs.
Read more
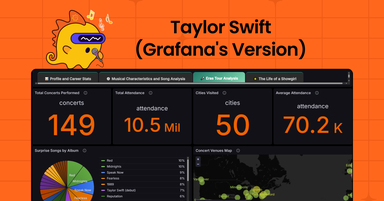
In celebration of The Life of a Showgirl, a team of Grafanistas used Grafana Assistant to build a dazzling dashboard that lets you visualize the eras...
Read more
Find out why companies such as Shopify and Uber are seeing the value of continuous profiling.
Read more
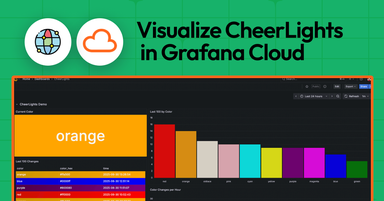
Learn how to use Grafana Cloud and the Infinity data source to visualize live JSON data from the CheerLights IoT project.
Read more
Grafana Labs was a proud sponsor of the HackUPC event, where students from around the world built some innovative, Grafana-powered dashboards to track...
Read more
Meet Project Bob, which aims to be the first autonomous boat to circumnavigate the globe, thanks, in part, to Grafana.
Read more
