The Splunk plugin for Grafana now supports data links for jumping directly from logs to traces
This post has been updated to reflect changes in the availability of the Splunk data source plugin for Grafana Cloud users.
Hey there! This is Éamon Ryan from the Solutions Engineering team. To start off 2021, the Splunk data source plugin, which is available for users with a Grafana Cloud account or with a Grafana Enterprise license, had a new release: v2.1.0. While it added a few good bug fixes for edge cases, the biggest change, I think, was the addition of support for data links!
What’s a data link?
Data links actually show up in a few places inside Grafana. They let you link from some point of data to another, whether that is within Grafana or external to it, such as in a new tab. One recent example is in exemplar support, which was introduced in Grafana 7.4 and was added to Grafana Cloud.
They can be used with the time series panel, stat panel, gauge panel, or bar gauge panel, for example. Alternatively, some data sources include support for them, such as the Elasticsearch and Grafana Loki data source plugins. (Loki refers to them as “derived fields” since there is an element of parsing that occurs first.)
What would I use data links for?
Say you wanted to click a graph line or bar, or you wanted some log field to send to some other tool. That’s exactly what you could use data links for!
One of the most powerful uses of this feature is enabling the jump from logs to traces within Grafana without losing any context. As you may be aware, since Grafana 7.0, you’ve had the ability to add either the Zipkin or Jaeger tracing backends as data sources. Grafana 7.3 added support for the Grafana Tempo tracing backend data source, giving you three possible tracing solutions to jump to and visualize within Grafana!
How to get started
So, if I have one of these tracing systems, how do I jump to the traces from my Splunk logs?
Assuming you have:
- Grafana Enterprise configured with the Spunk plugin version >= 2.1.0
(If you don’t have a Grafana Enterprise license, you can also access the Splunk plugin through Grafana Cloud. Sign up now!) - A tracing backend data source configured: Tempo, Jaeger, or Zipkin
- Your application code instrumented to log trace IDs
Then, it’s a pretty simple modification to your Splunk’s data source config to get this going!
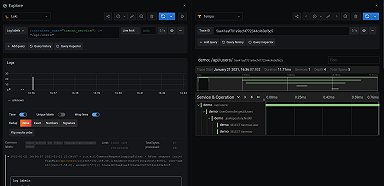
First, verify your trace IDs are appearing in your logs. Here I’m just doing a simple Explore:

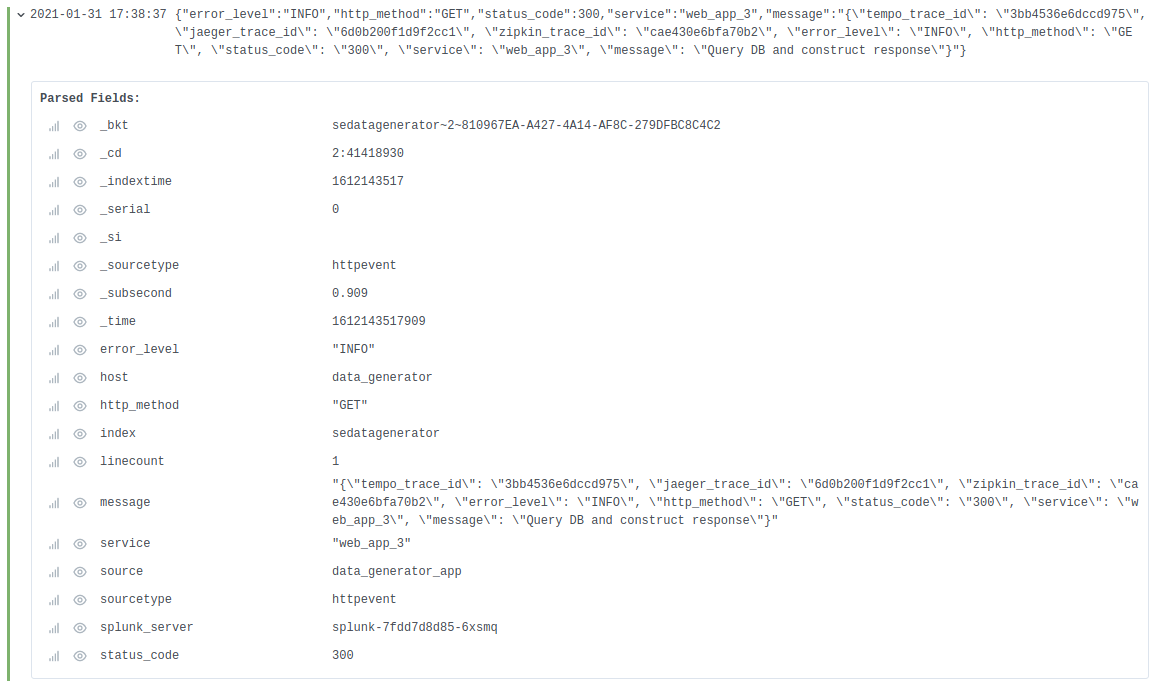
As you can see in the full log line at the bottom, I’ve actually got this application outputting trace IDs for all three possible backends — Grafana Tempo, Jaeger, and Zipkin — in the form of tempo_trace_id, jaeger_trace_id, and zipkin_trace_id, respectively.
If I expand the log line I can check out all of the fields and see the trace IDs sitting in the message field:
All right, so I’ve got trace IDs; now to have them do something!
In my Splunk data source’s config, there’s a new section at the bottom:

Clicking Add shows the fields to be filled in:

I’m going to add three links, just to show all three tracing backends working. They mostly use the same regex, e.g., /tempo_trace_id[^0-9a-z]*(\[0-9a-z]+)/.
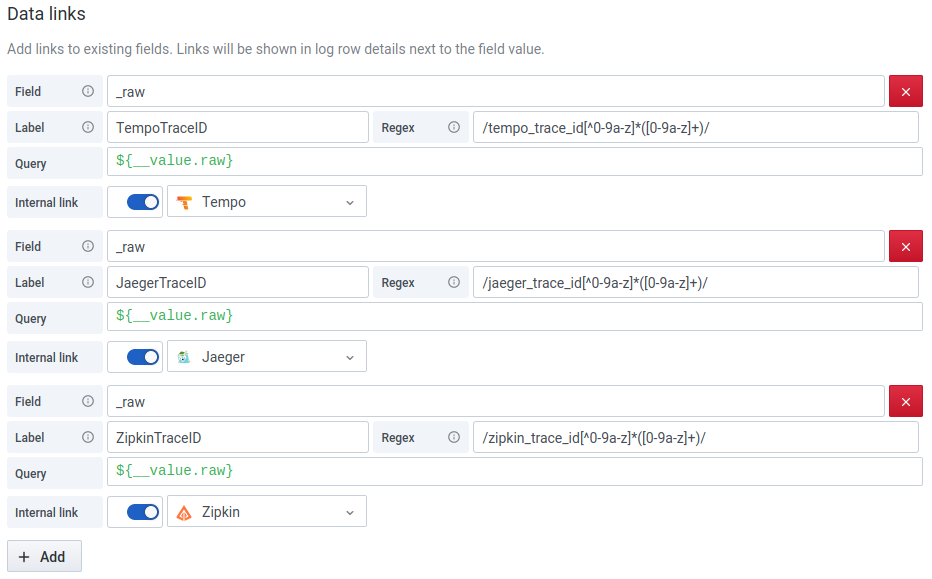
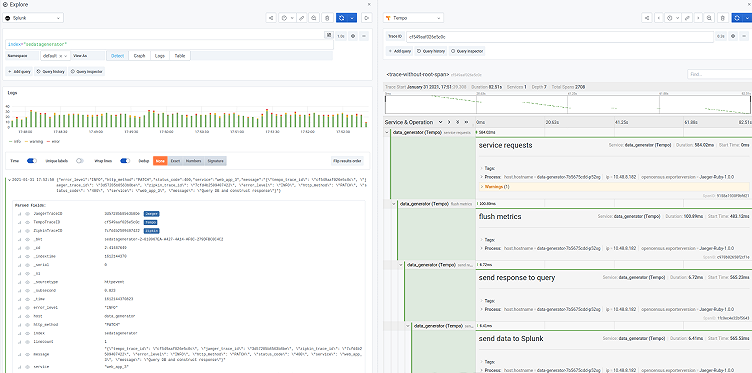
A quick click of Save & Test to let me know I haven’t made any glaring mistakes, and I’m ready to check back on the Explore page:
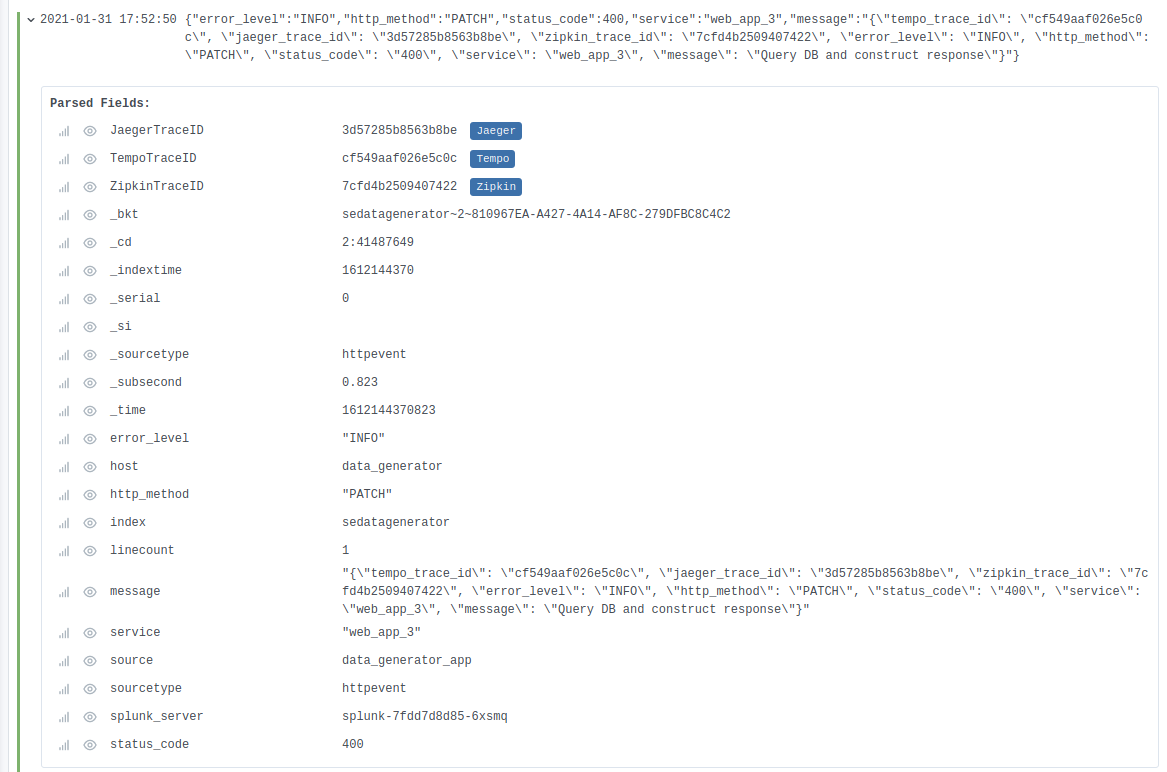
What’s different? Notice how I now have three new Parsed Fields right at the top, each for one of my corresponding data links. That’s neat enough by itself, since I didn’t have to modify my configuration on the Splunk side at all to pull these out!
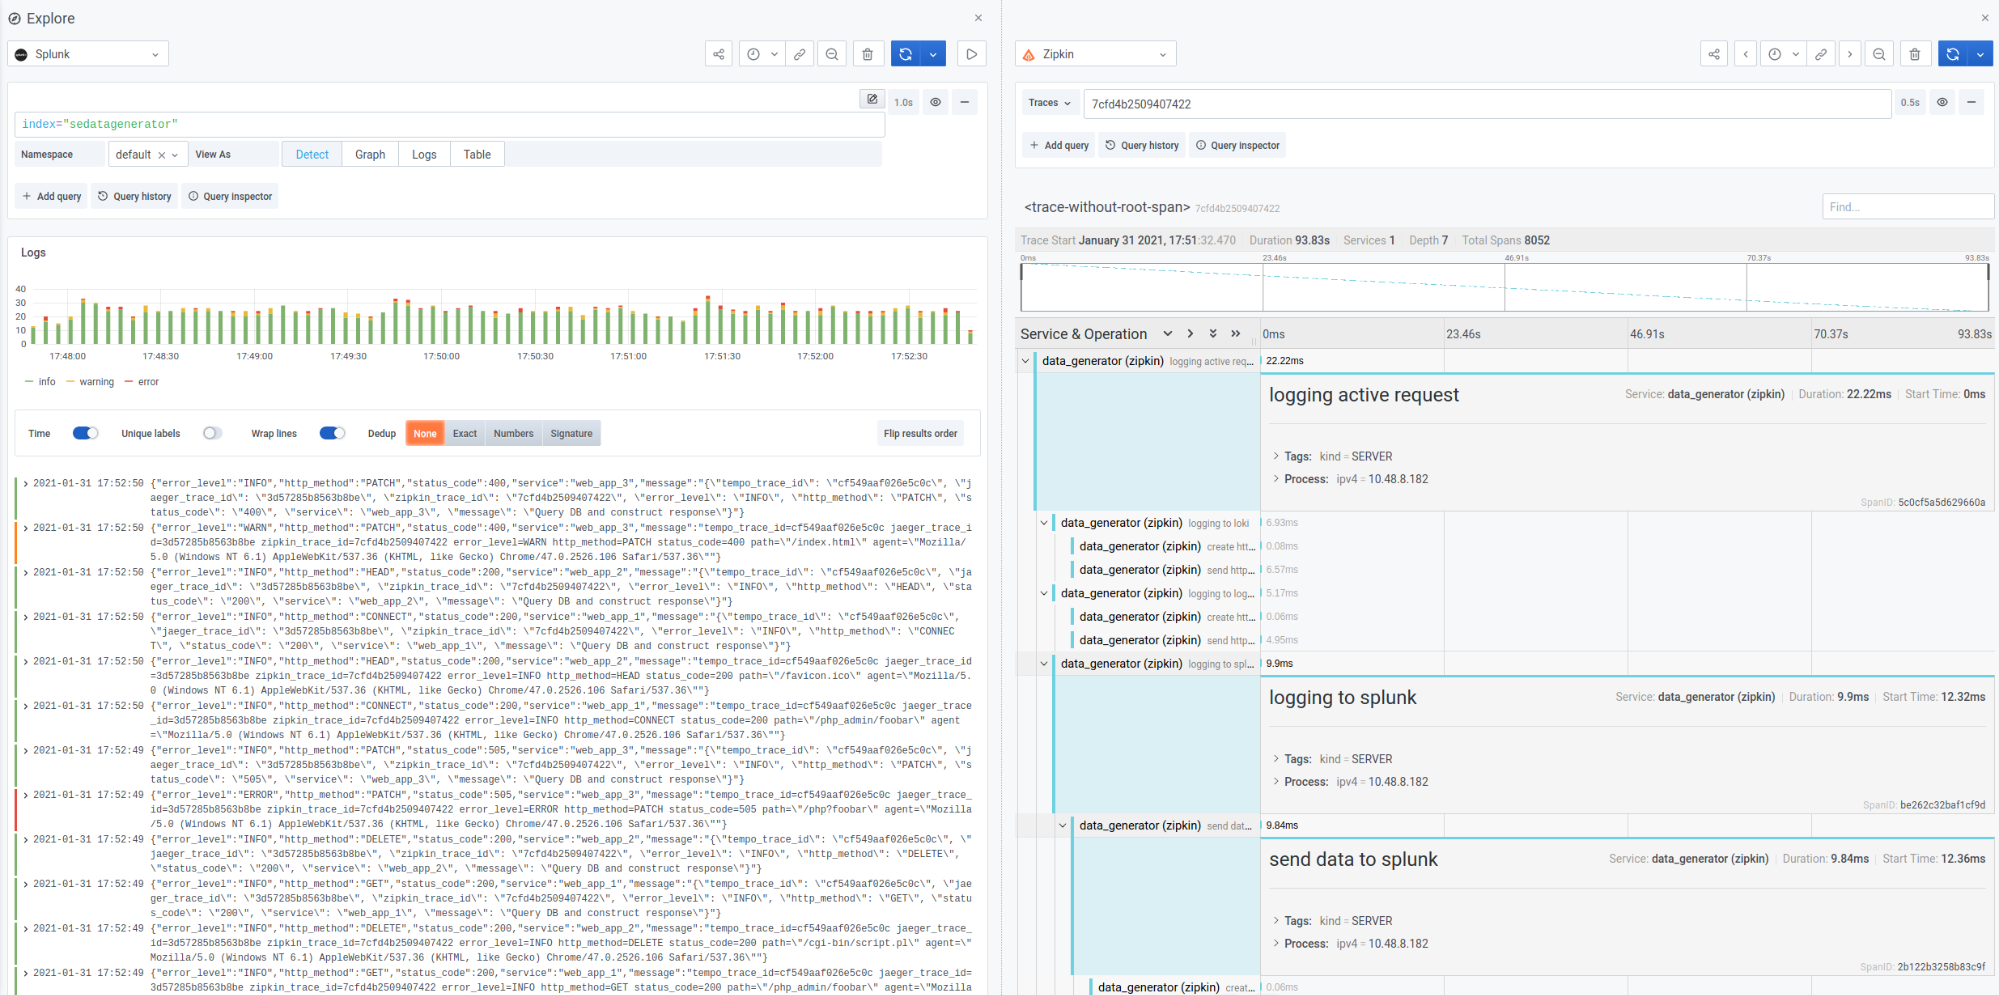
However, the blue labels are the real magic here: Clicking any of them will split the Explore pane into two and show me the exact trace in question!
Tempo:

Jaeger:
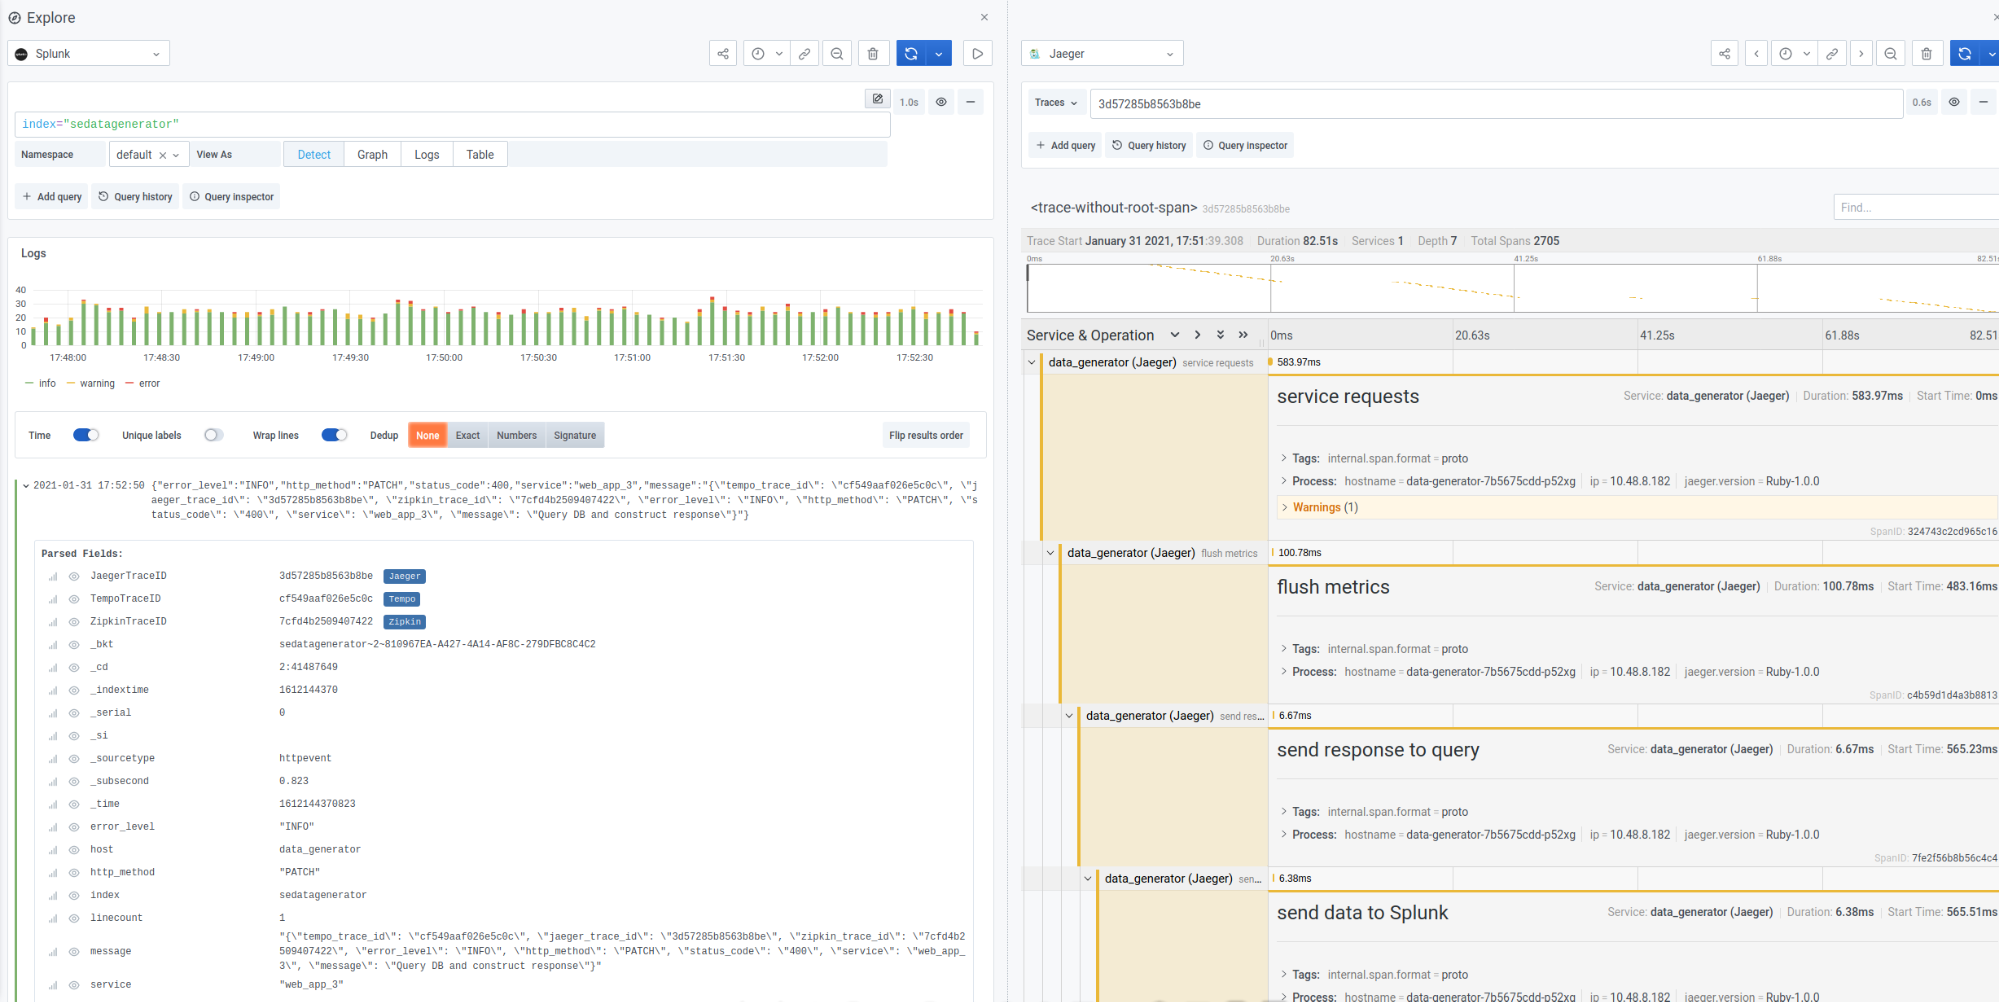
Zipkin:
How does this help?
This is actually a two-part answer.
The first way this helps is one of Grafana’s big goals and advantages: Democratizing your data, making it easier to see everything in one place. By removing the need for you to jump to your tracing backend separately and re-establish context in order to narrow down your relevant traces, you can investigate, observe, and solve issues faster.
The second way this helps is with Grafana Tempo in particular if you opt to use it. There is a fantastic blog post on Grafana Tempo already out there explaining what Tempo is as well as a webinar available on demand, but to give just a few bullet points in the context of this blog post:
- Existing tracing solutions have to store large indexes (via tools like Cassandra or Elasticsearch) of traces to make them searchable.
- Large indexes are expensive, so it can be cost-prohibitive to store all trace samples.
- Tempo doesn’t index traces; it’s essentially a traces-by-id storage machine.
- Therefore, Tempo can run for a fraction of the cost of other tracing backends, while also being able to store 100% of traces.
So you can store 100% of your traces in a cost-effective way by using Tempo as your backend while still being able to maintain your Jaeger/Zipkin/OpenTelemetry application instrumentation, just modifying where the traces are sent. The only trade-off is you have to know the exact ID of your traces to find them. Data links are what allow you to complete the puzzle and seamlessly handle that trade-off, all right inside Grafana.
This was already possible with Grafana Loki and Elasticsearch, but now with the 2.1.0 version of the Splunk plugin, it’s a capability extended to Splunk too! If you were previously a “Tempo looks great, but I can’t jump to traces right from Splunk so I can’t use it” person, well, fret no more!
Learn more
The improvements to the Splunk plugin make a great addition to the tracing story, which, if you haven’t heard, got some recent additions over in the metrics -> traces side of the equation, too, in the form of support for Prometheus exemplars in Grafana 7.4 and in Grafana Cloud.
To learn more or get started with the Splunk data source plugin, read more on the Splunk solutions page or contact our team.
If you’re not already using Grafana Cloud — the easiest way to get started with observability — sign up now for a free 14-day trial of Grafana Cloud Pro, with unlimited metrics, logs, traces, and users, long-term retention, and access to one Enterprise plugin.

