Grafana 7.4 released: Next-generation graph panel with 30 fps live streaming, Prometheus exemplar support, trace to logs, and more
Grafana v7.4 has been released!
The big news for Grafana 7.4 is the next-generation graph panel called time series, which is in beta. A high-performance visualization based on the uPlot library, it uses the new panel architecture introduced in Grafana 7.0 and integrates with field options, overrides, and transformations. The new times series panel already includes most of the functionality available in the current graph panel, and our plan is to have close to full coverage of the features when Grafana 8.0 is released later this year. Read more about the new panel below.
There are some other great features in this release, too. Here are some highlights:
- Prometheus exemplar support
- Variable inspector
- New node graph panel
- New transformations
- Trace to logs
- Server-side expressions
- Variable support in alert notifications
- Elasticsearch plugin updates
- Export Enterprise usage insights to Loki
Next-generation graph panel
Here’s a look at some of the features of the new time series graph panel.
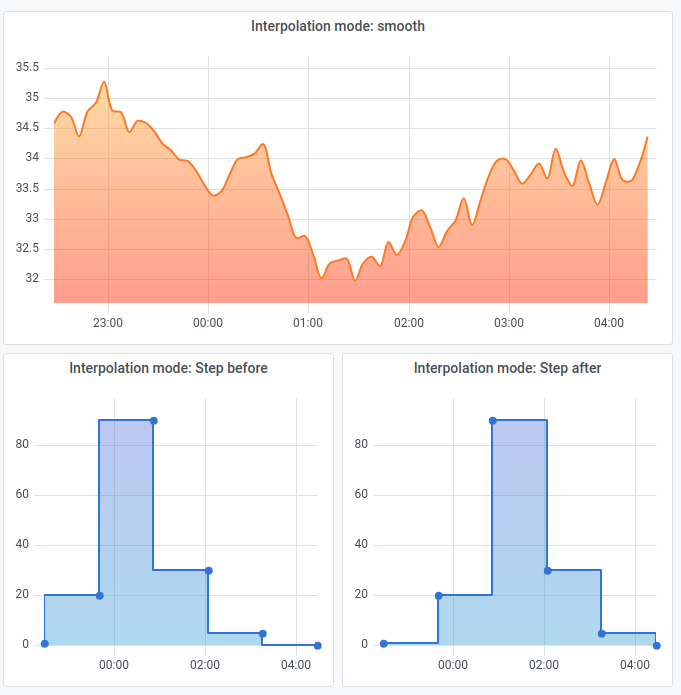
The new interpolation mode allows you to choose between smooth, step before (which is the same as the current graph panel’s staircase option), and step after.
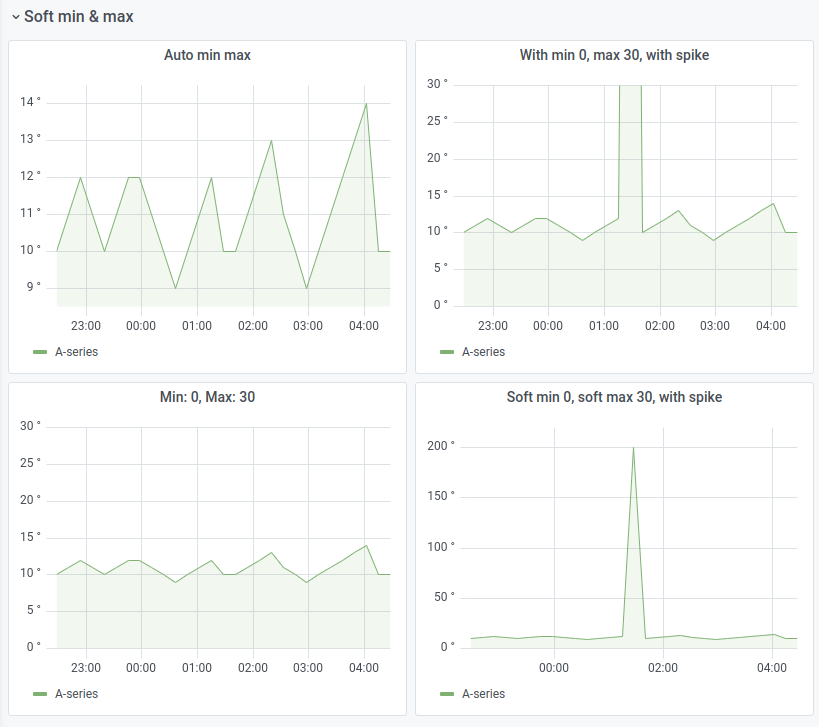
With the new soft min and max option, you can control the default axis range so that infrequent spikes in the data won’t get cut off.
The new graph panel supports more than the two y-axes that the current panel allows.

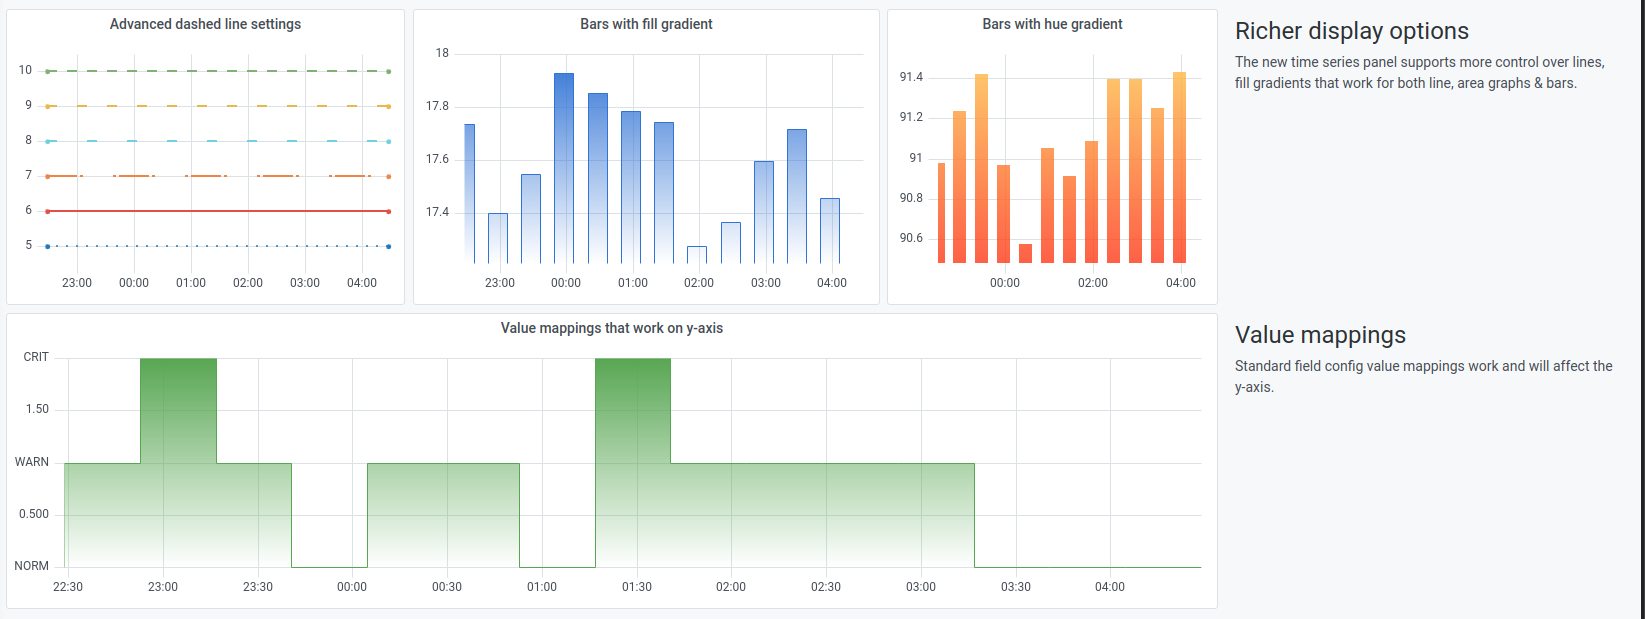
Plus, there are new display options to make your graphs shine: Together, fine-grain control over dashed lines and fill-coloring modes enable some stellar-looking charts!
And last but definitely not least, the new graph panel can render 30 fps for live streaming!
To see these features in action, check out this demo dashboard showcasing the new graph panel.
Prometheus exemplar support
Grafana Tempo, the distributed tracing backend we announced last year, relies on integrations with other data sources for trace discovery. Along with logs, Prometheus exemplars allow you to quickly and more powerfully jump directly to traces than ever before. We’re happy to announce that with v7.4, Grafana graphs now support Prometheus exemplars. They are displayed as diamonds in the graph visualization:
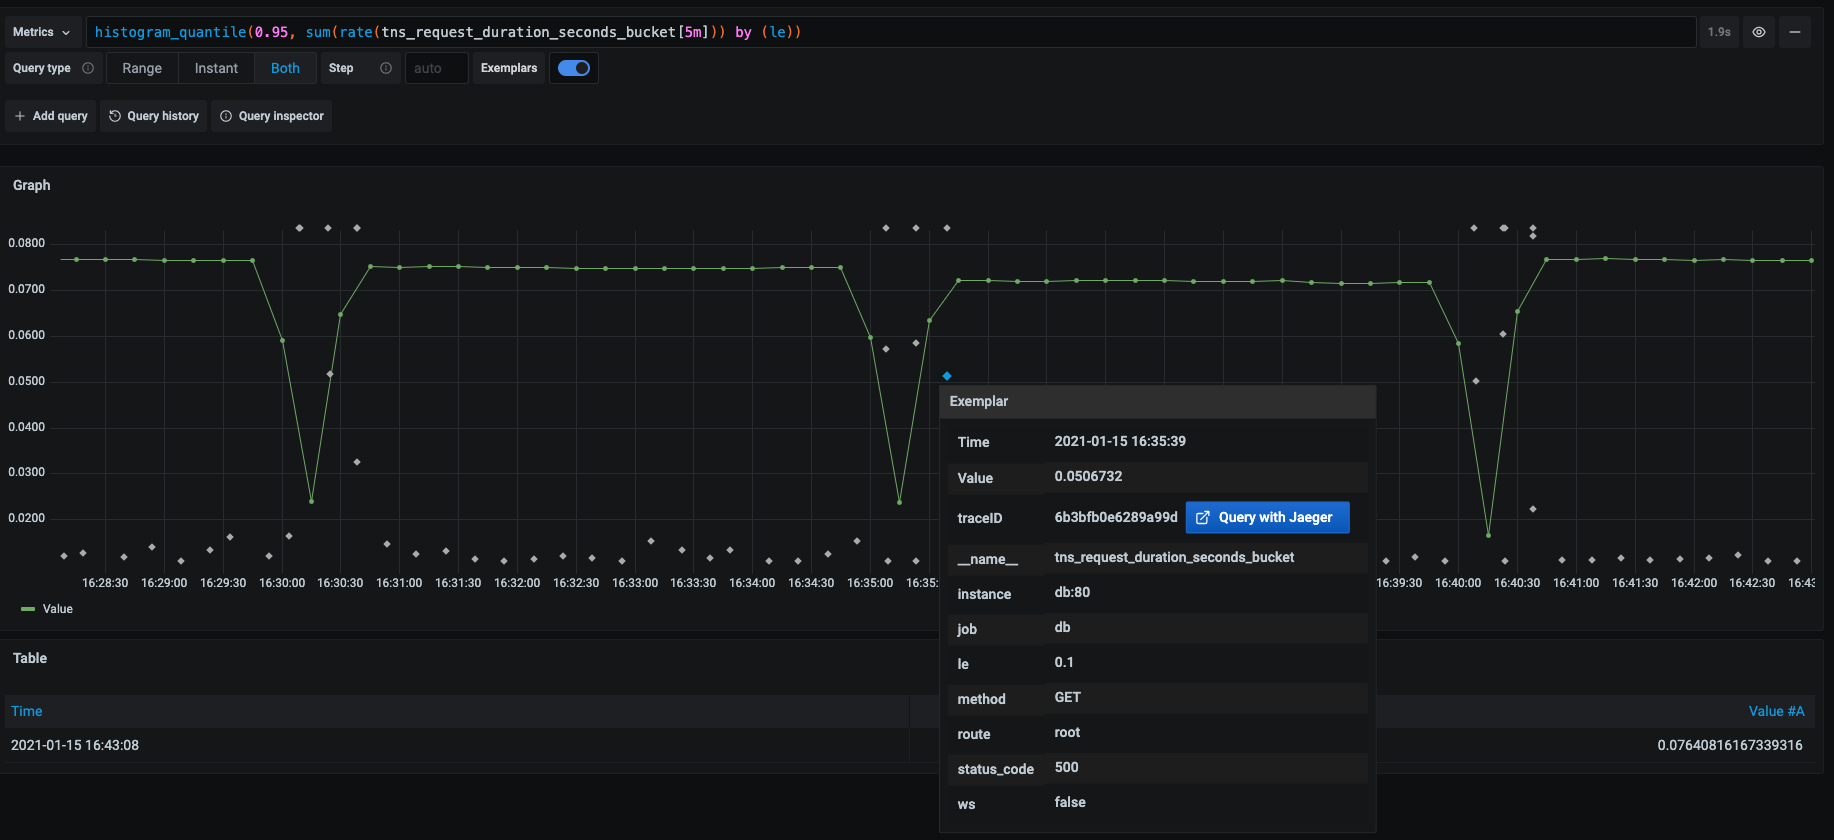
The support for exemplars in Prometheus will be in version 2.26+.
Variable inspector
If you’ve ever gotten lost trying to understand variable usage in dashboards, this new feature was designed to help you. The variable inspector provides more information about which variables are used and any dependencies that exist, to help viewers identify any less-than-obvious behavior.
New node graph panel
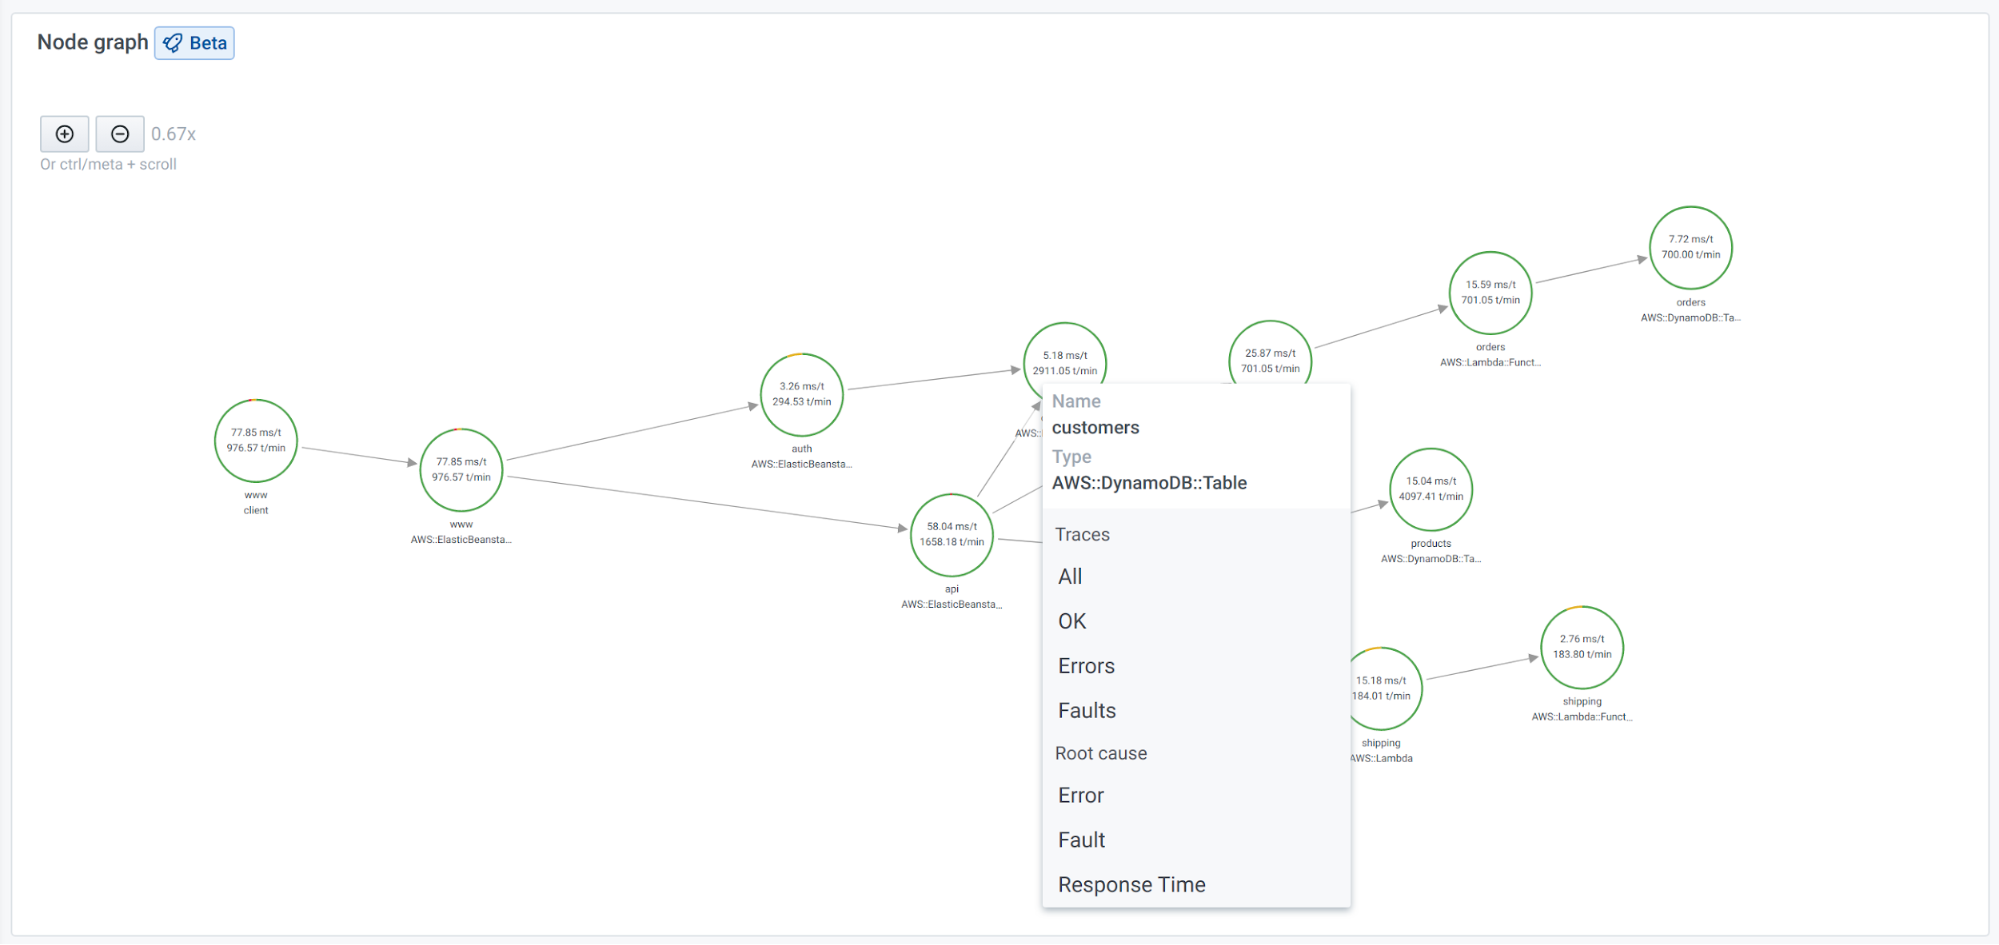
Available in beta in v7.4, this new panel type can visualize directed graphs or networks in dashboards as well as in Explore. Nodes are positioned using a directed force layout, so you can more effectively display complex infrastructure maps, hierarchies, or execution diagrams.
The AWS X-Ray data source is using this panel for displaying service map data:
If you’re interested in using the Node graph in your Grafana dashboards or in a plugin you’re developing, check out the node graph documentation.
New transformations
The Sort by transformation allows you to sort data before sending it to the visualization.
The Filter data by value transformation allows you to filter your data in Grafana and remove data points from your query result. This transformation is very useful if your data source does not natively filter by values. You could also use it to narrow the values to display if you are using a shared query.
Trace to logs
As noted above, you can use Loki 2.0 queries for trace discovery with Tempo and jump directly from logs to traces. The reverse is also true with this feature, which allows you to navigate from a span in a trace view directly to the logs relevant for that span. This is currently available for the Tempo, Jaeger, and Zipkin data sources.
Server-side expressions
This experimental feature lets you manipulate data returned from backend data source queries with math and other operations. The primary intended use case is for multi-dimensional data sources used with the upcoming next-generation alerting, but it can be used with backend data sources and visualization as well.
Variable support in alert notifications
Using labels, this feature allows you to inject alert query data into the rule name and the message fields of an alert notification, so you can provide recipients with more detailed information that will help them dive in and troubleshoot more quickly.
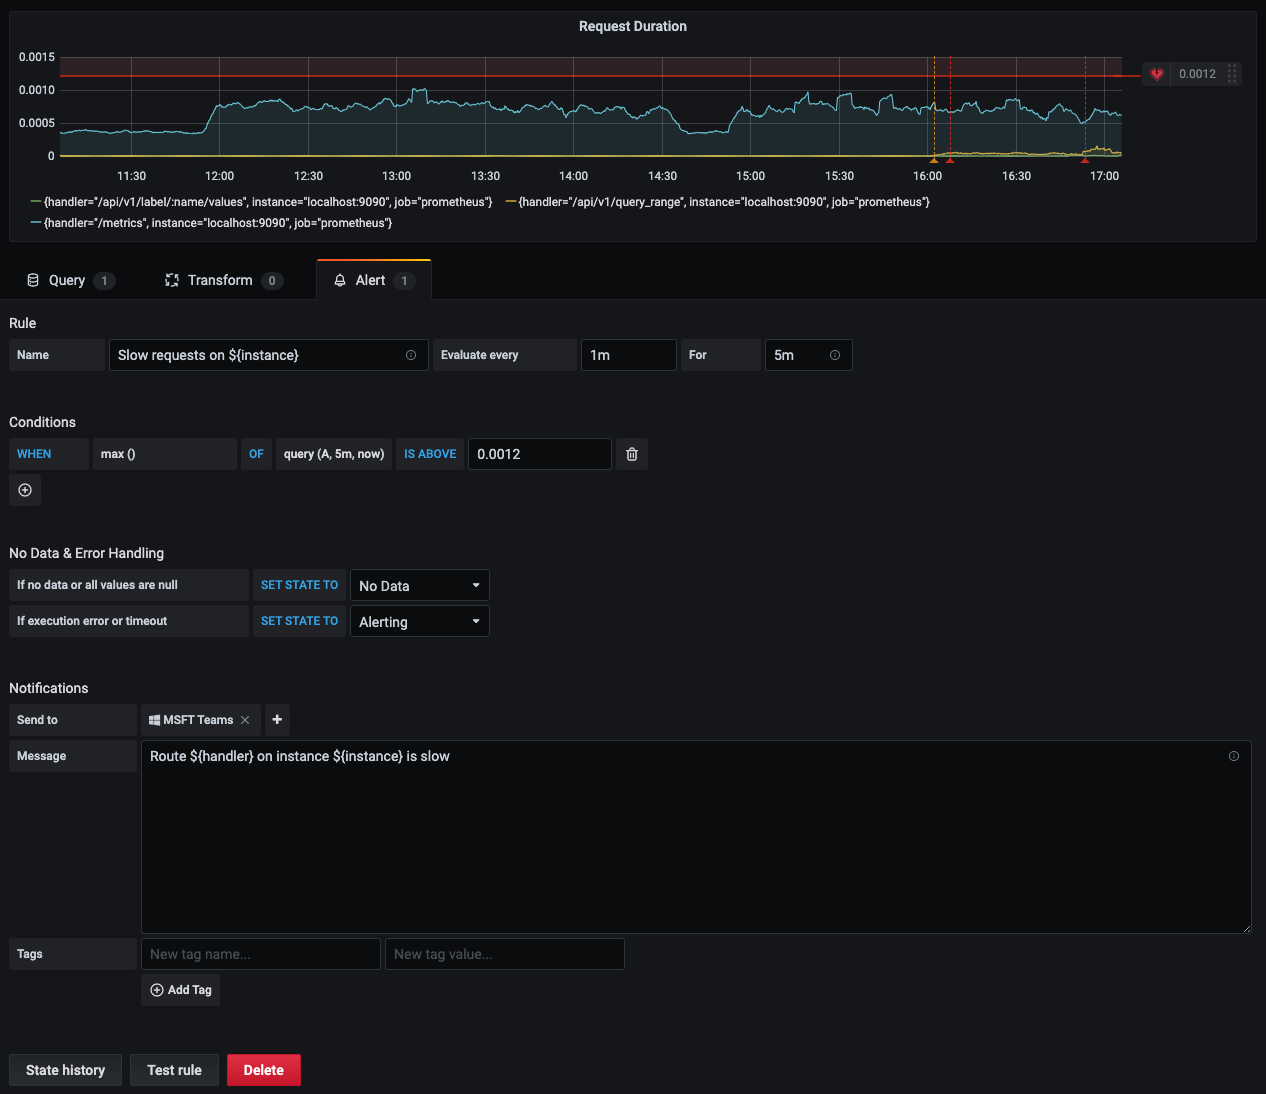
Elasticsearch plugin updates
Some important backend enhancements won’t change the look and feel of the plugin, but will improve your experience with alerts and aggregations.
Export Enterprise usage insights to Loki
Usage insights were introduced in Grafana 7.0 to help you manage dashboard sprawl, identify error-prone data sources, and understand where users are spending their time in Grafana. Since that launch, customers have sought more usage detail and customization options. If you are a Grafana Enterprise customer, you can now export your usage insights events as logs to Loki, and use the data to make detailed dashboards that show how users are working in Grafana. Logs include the details of each dashboard visit and data source query, so you can troubleshoot and help individual users faster, as well as organize and display the data to suit your needs. Find out more in our docs.
Changelog
Check out CHANGELOG.md for a complete list of new features, changes, and bug fixes.
Upgrade Grafana
Download or try Grafana 7.4 in the cloud today.
The easiest way to get started with Grafana, Prometheus, Loki for logging, and Tempo for tracing is Grafana Cloud, and we’ve recently added a new free plan and upgraded our paid plans. If you’re not already using Grafana Cloud, sign up today for free and see which plan meets your use case.
Refer to Upgrading for more information about upgrading your Grafana installation.
Interested in getting started with Grafana? Watch this webinar for a demo of the user interface and setup.
Thanks
A big thanks to all the Grafana users who contributed by submitting PRs, bug reports, and feedback!

