
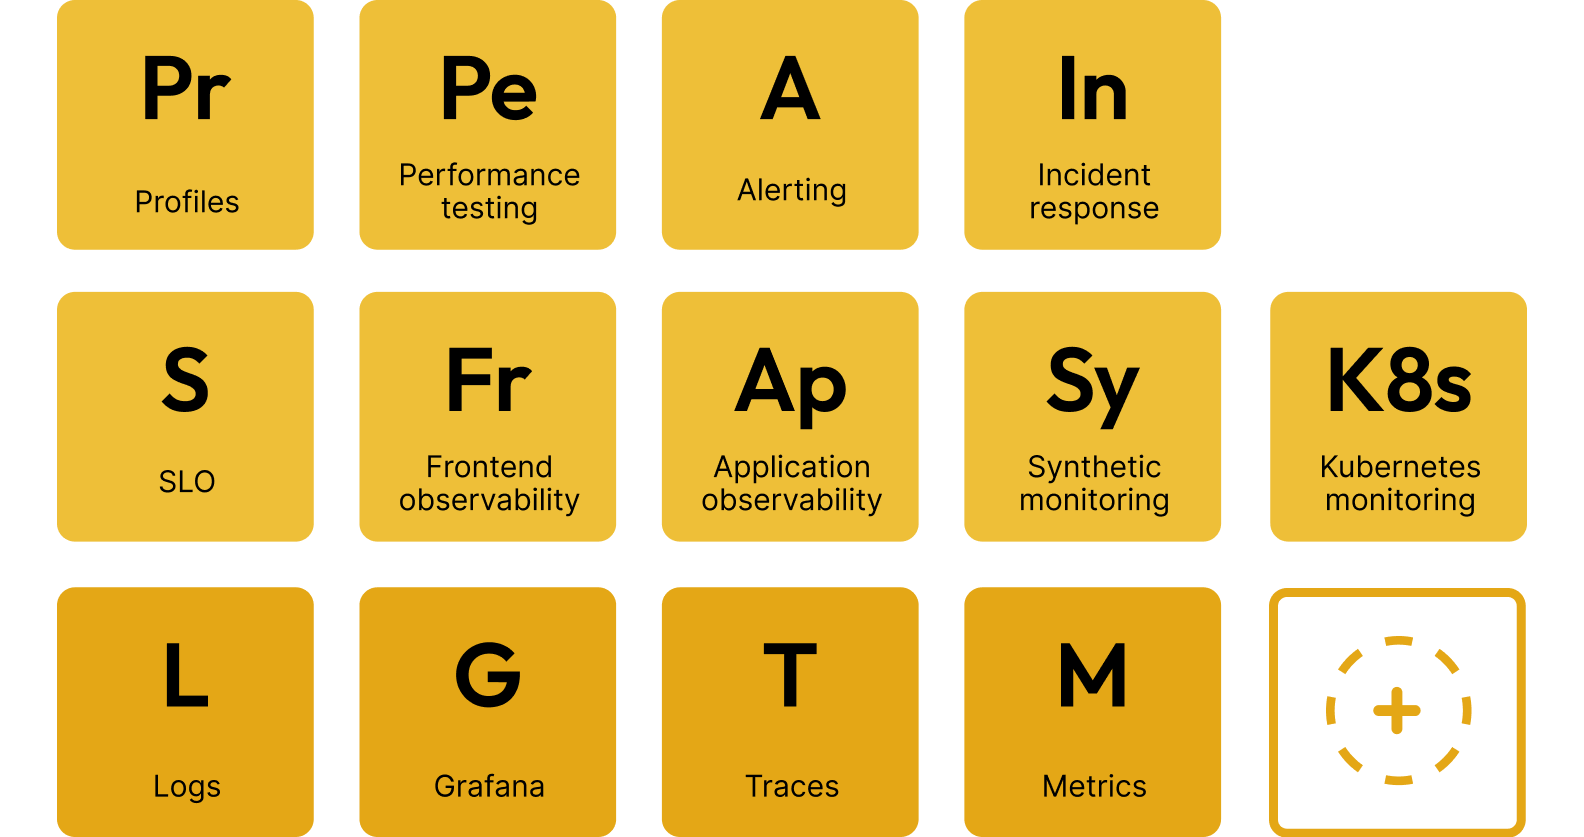


Compose and scale your observability with one, some, or all of the Grafana Stack pieces
Query /
keep data where it is

Send data to backends
Open standards: OTel, Prometheus
No lock-in
Open standards: OTel, Prometheus
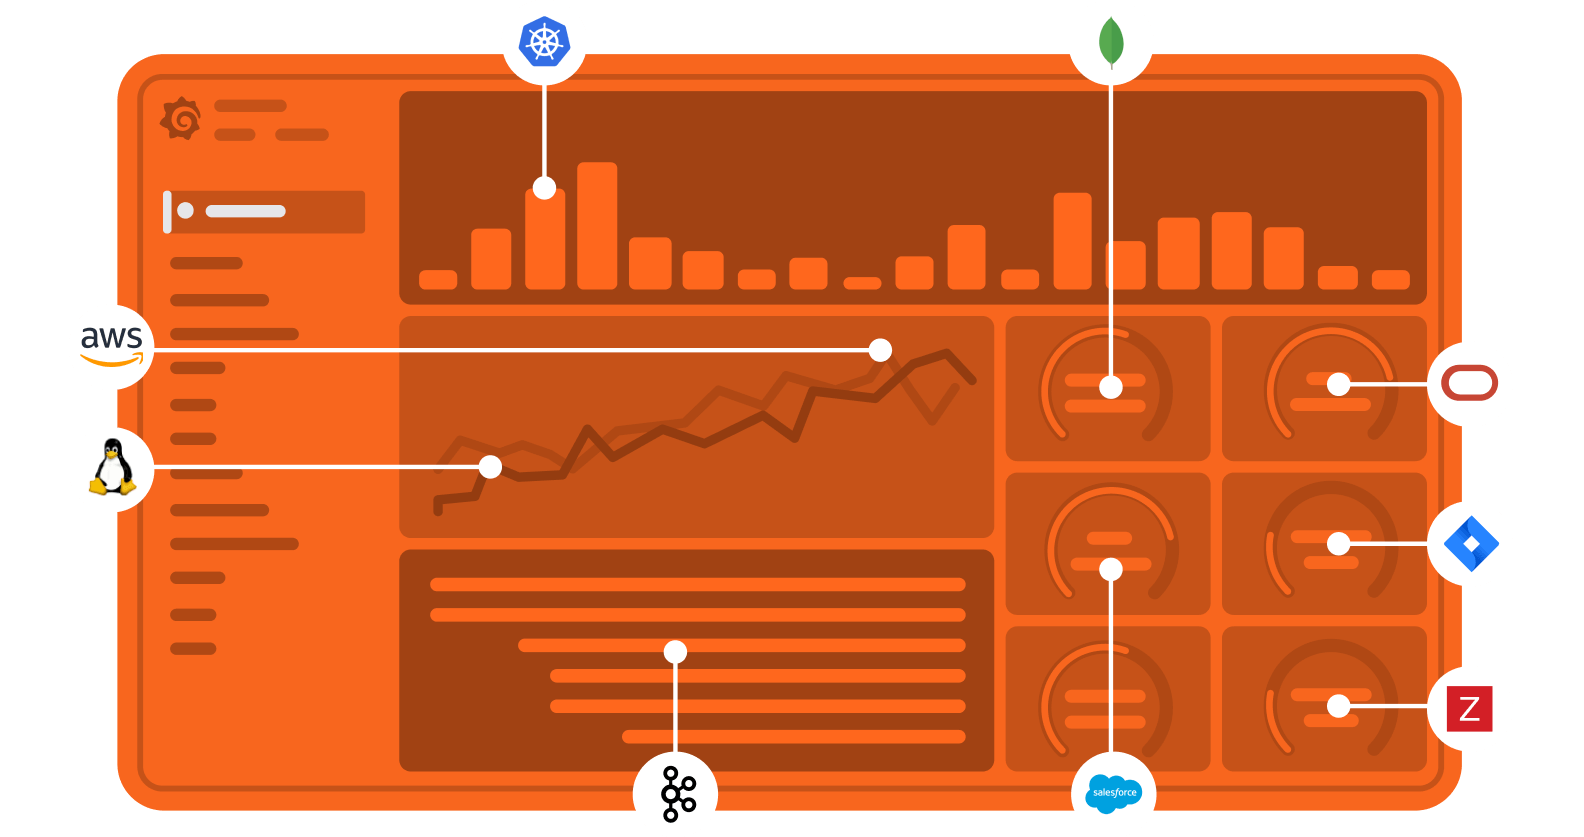
Your tools / data
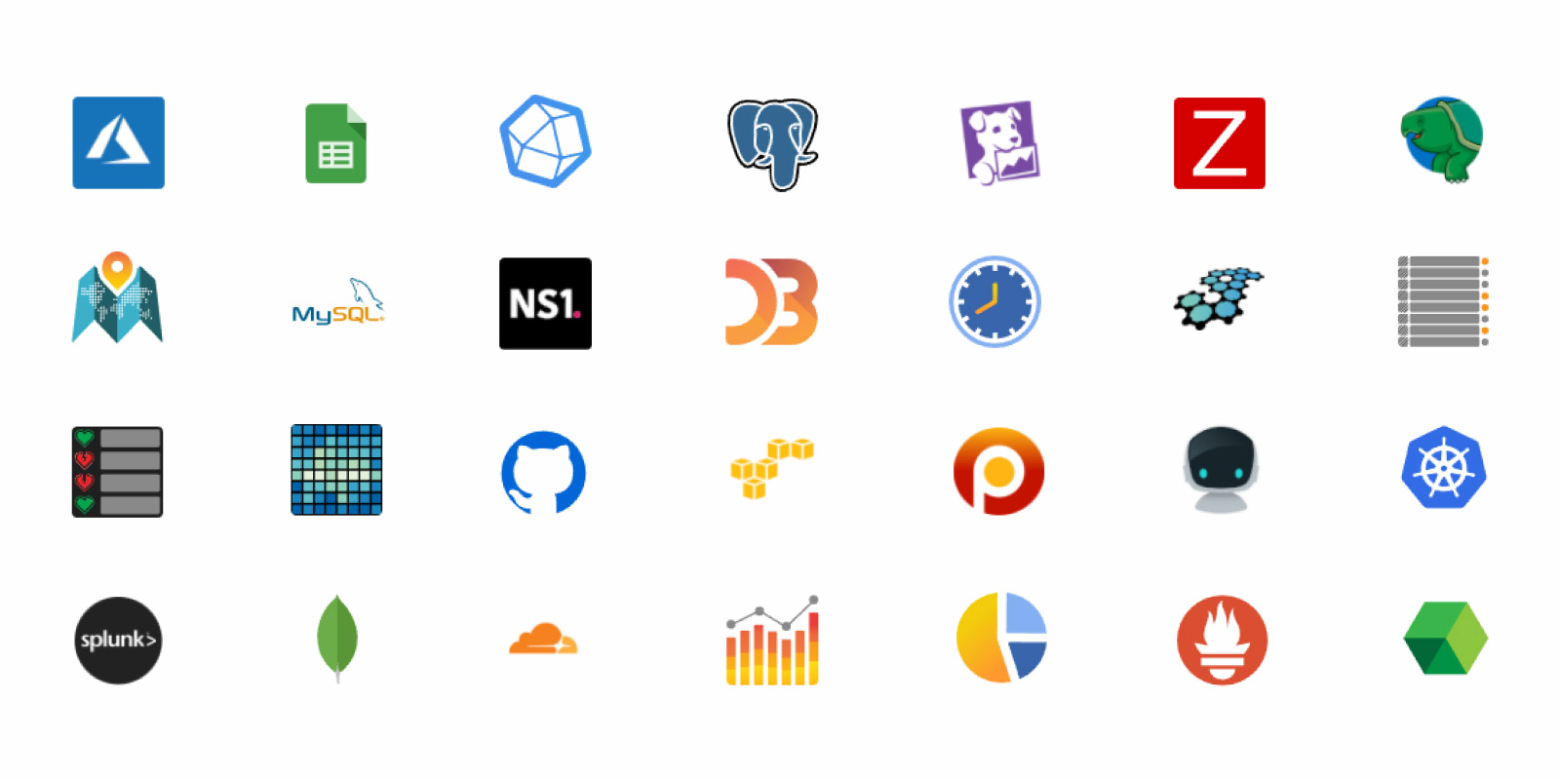
Connect your tools and your teams with Grafana plugins. Data source plugins hook into existing data sources via APIs and render the data in real time without requiring you to migrate or ingest your data.
Your environment
Send your local data to Grafana’s backend for long-term storage, aggregation, and high-performance querying. Forward your metrics, logs, traces, and profiles using existing services deployed into your environment.
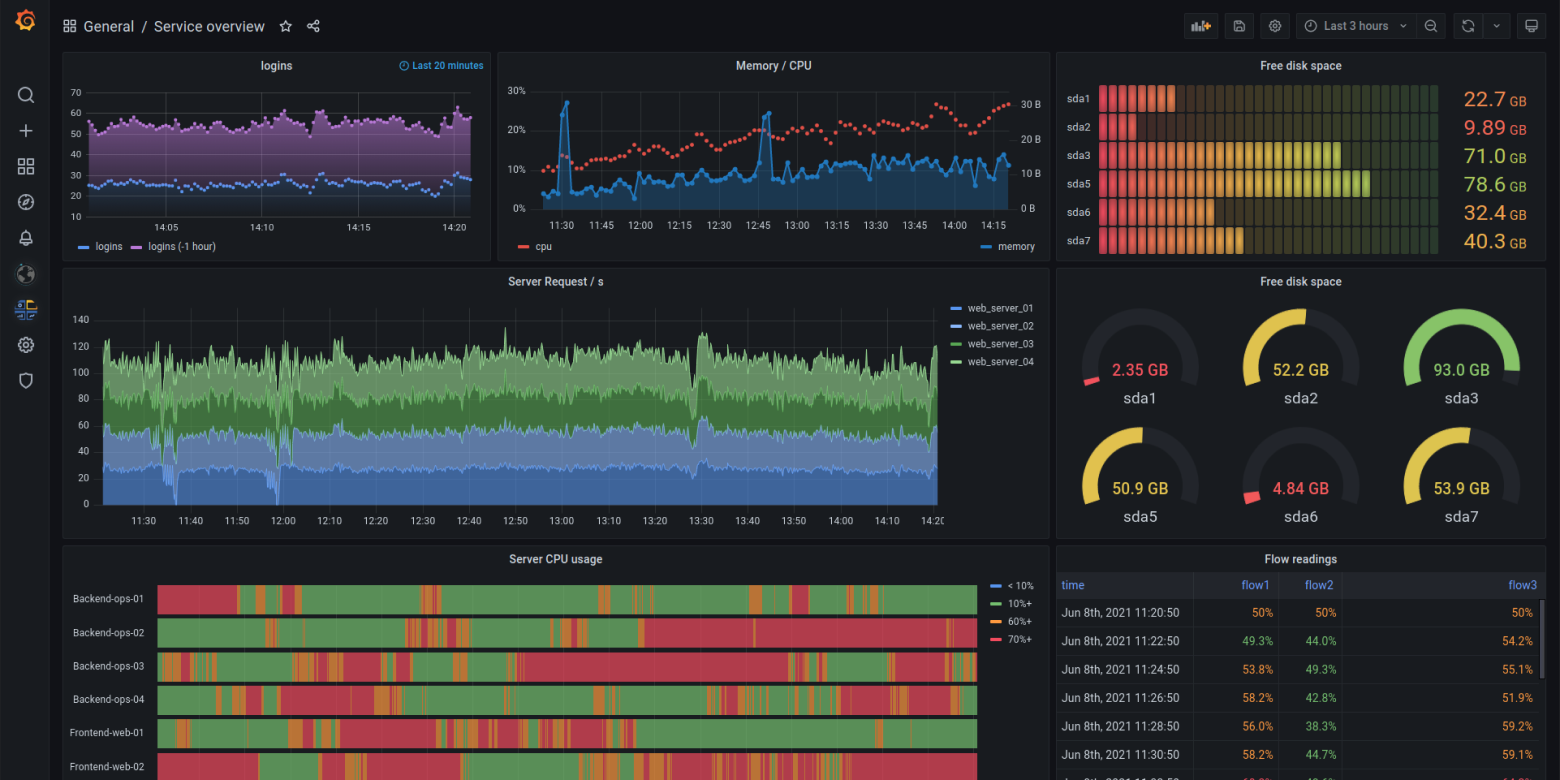
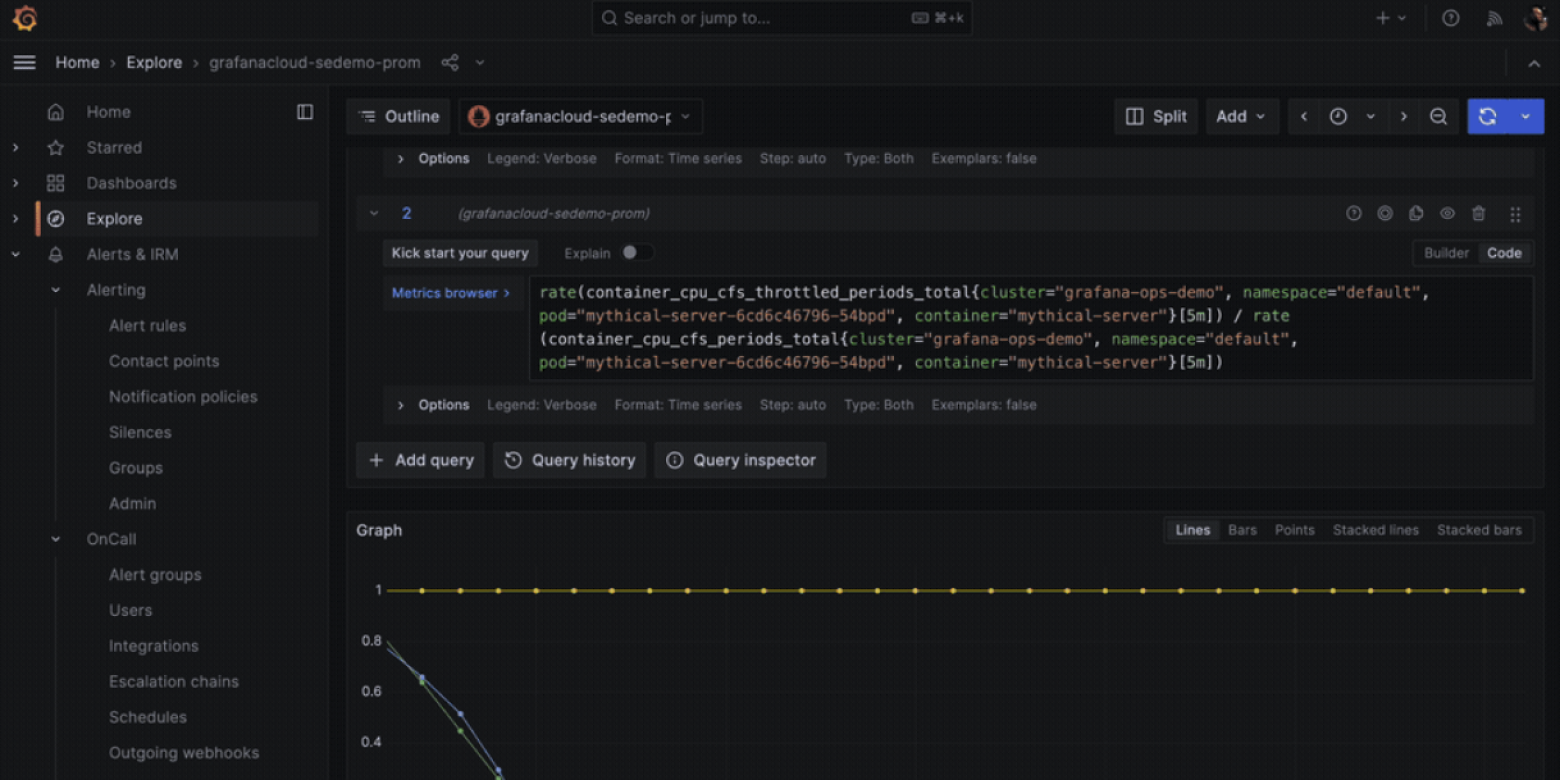
Visualization
Grafana allows you to query, visualize, alert on, and understand your metrics no matter where they are stored. Create, explore, and share beautiful dashboards with your team and foster a data-driven culture.
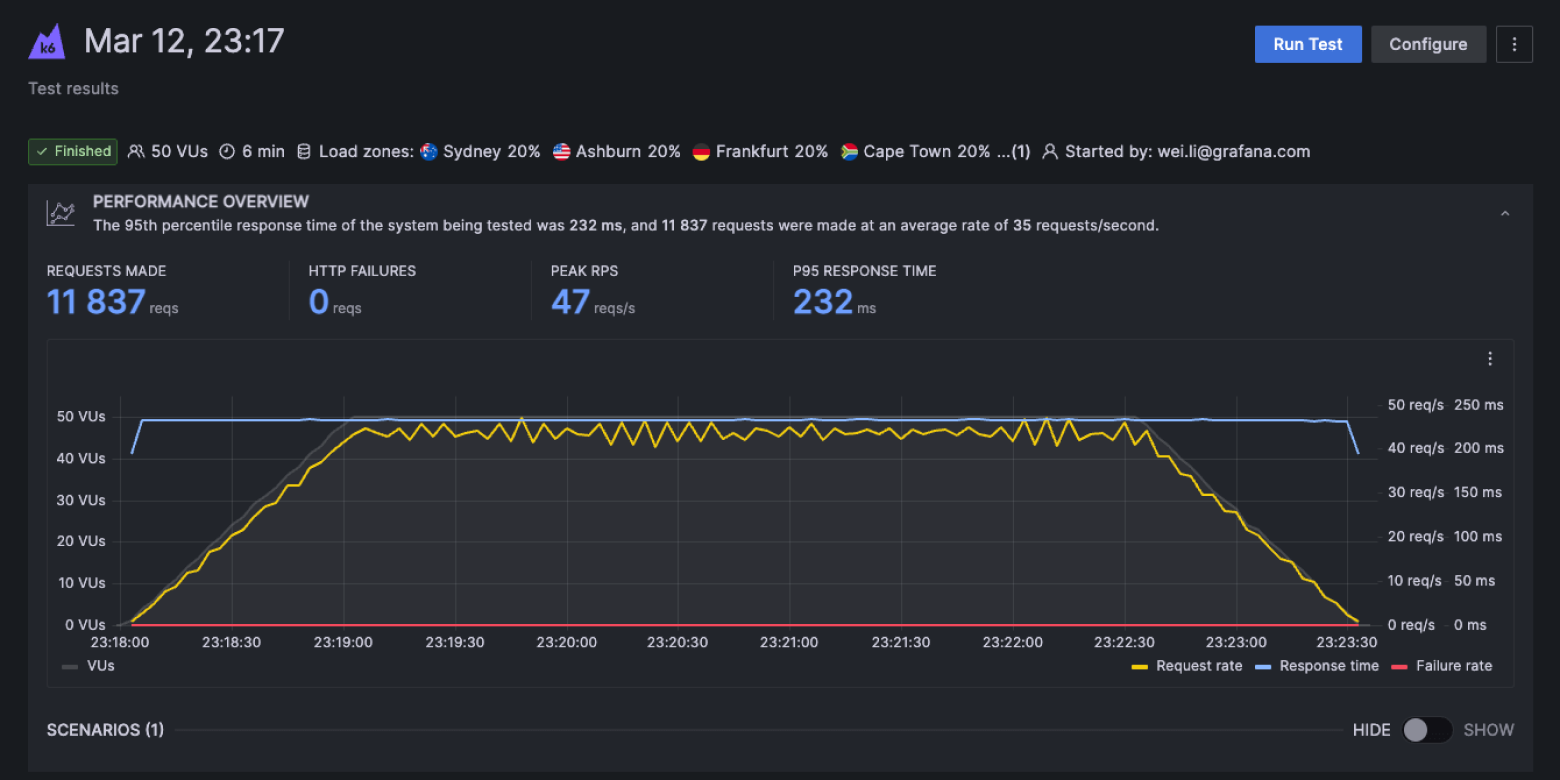
Performance testing
Easily run cloud-based performance tests to boost release confidence and velocity.
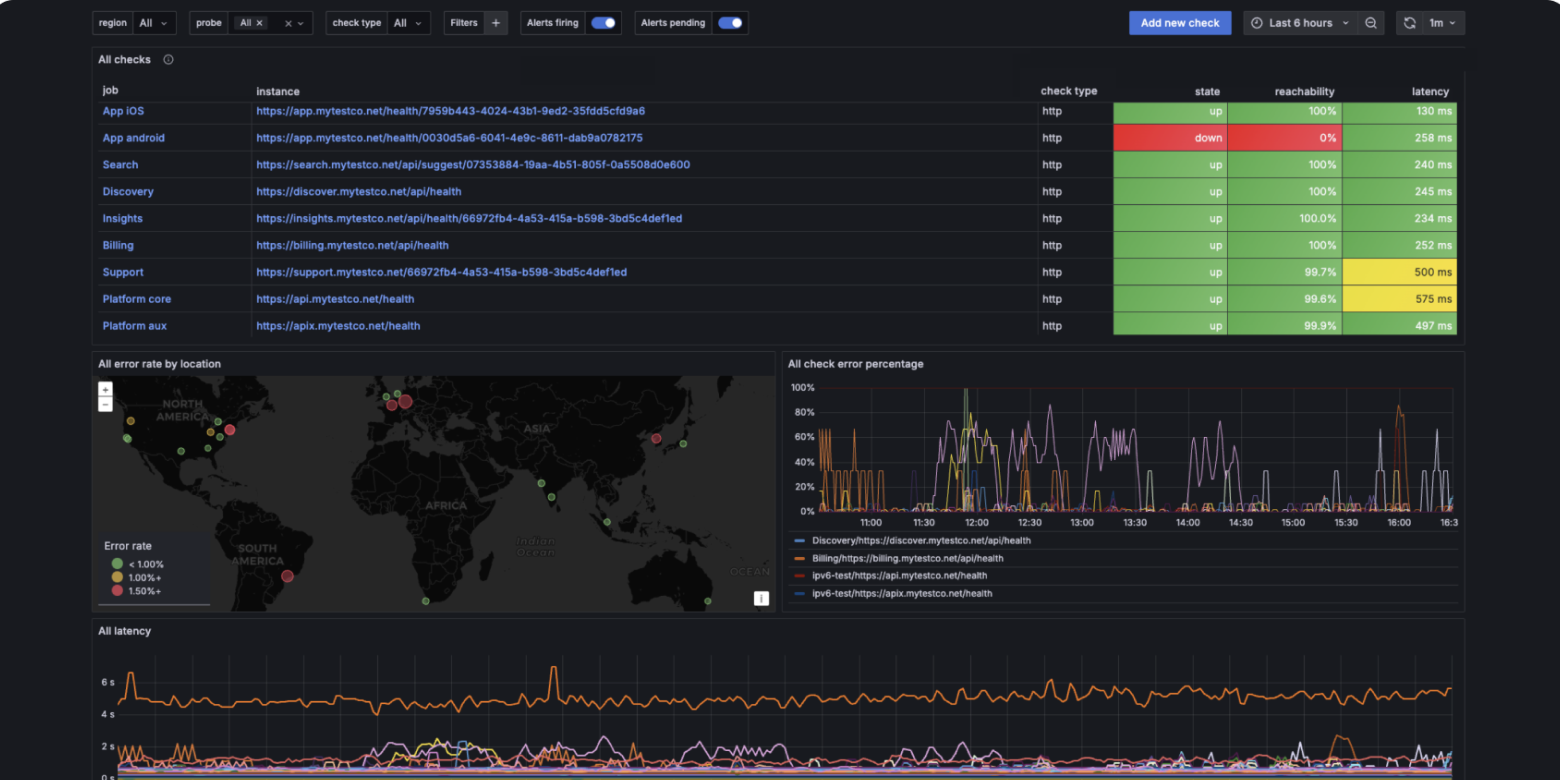
Synthetic monitoring
Proactively monitor the performance of your APIs and web applications from the user’s perspective, testing the availability, health, and quality of your services around the world.
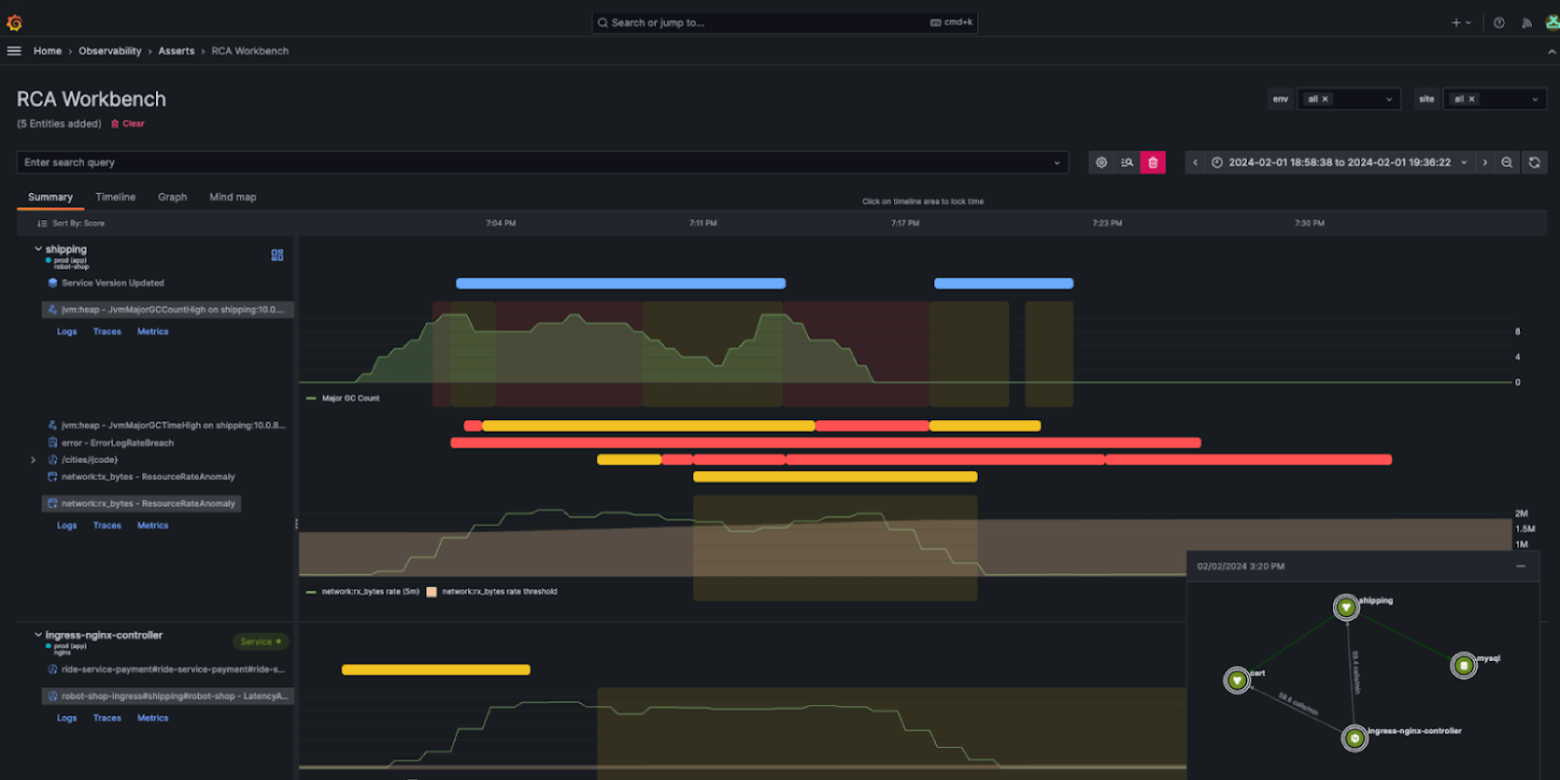
Contextualized Root Cause Analysis
Add an intelligence layer to your telemetry data to better understand the behavior of your applications and services. Uncover root causes quickly as related issues are automatically correlated.
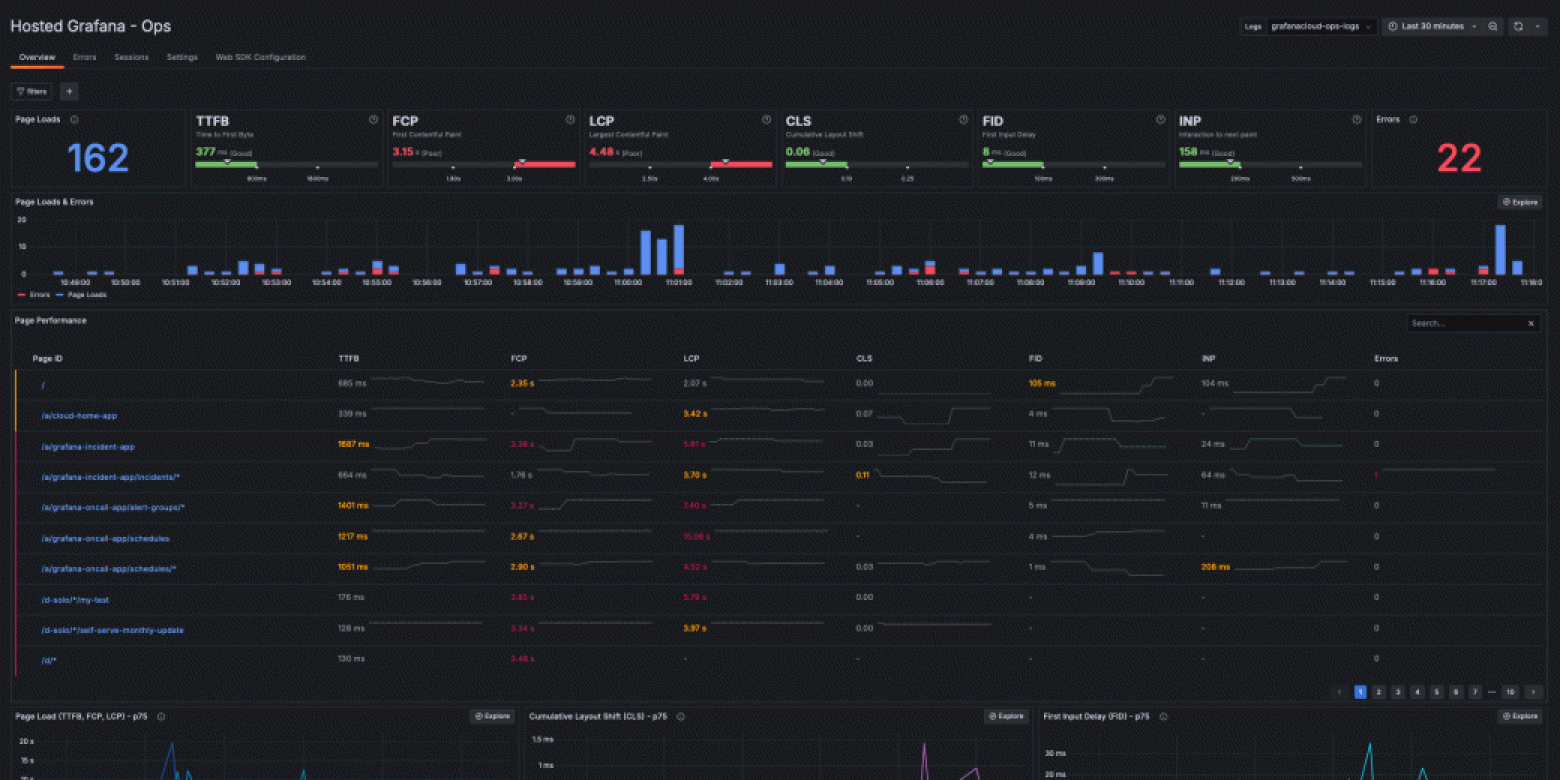
Frontend Observability
Gain clear, actionable insights into the end user experience of web applications with data on real-time frontend health and frontend errors.
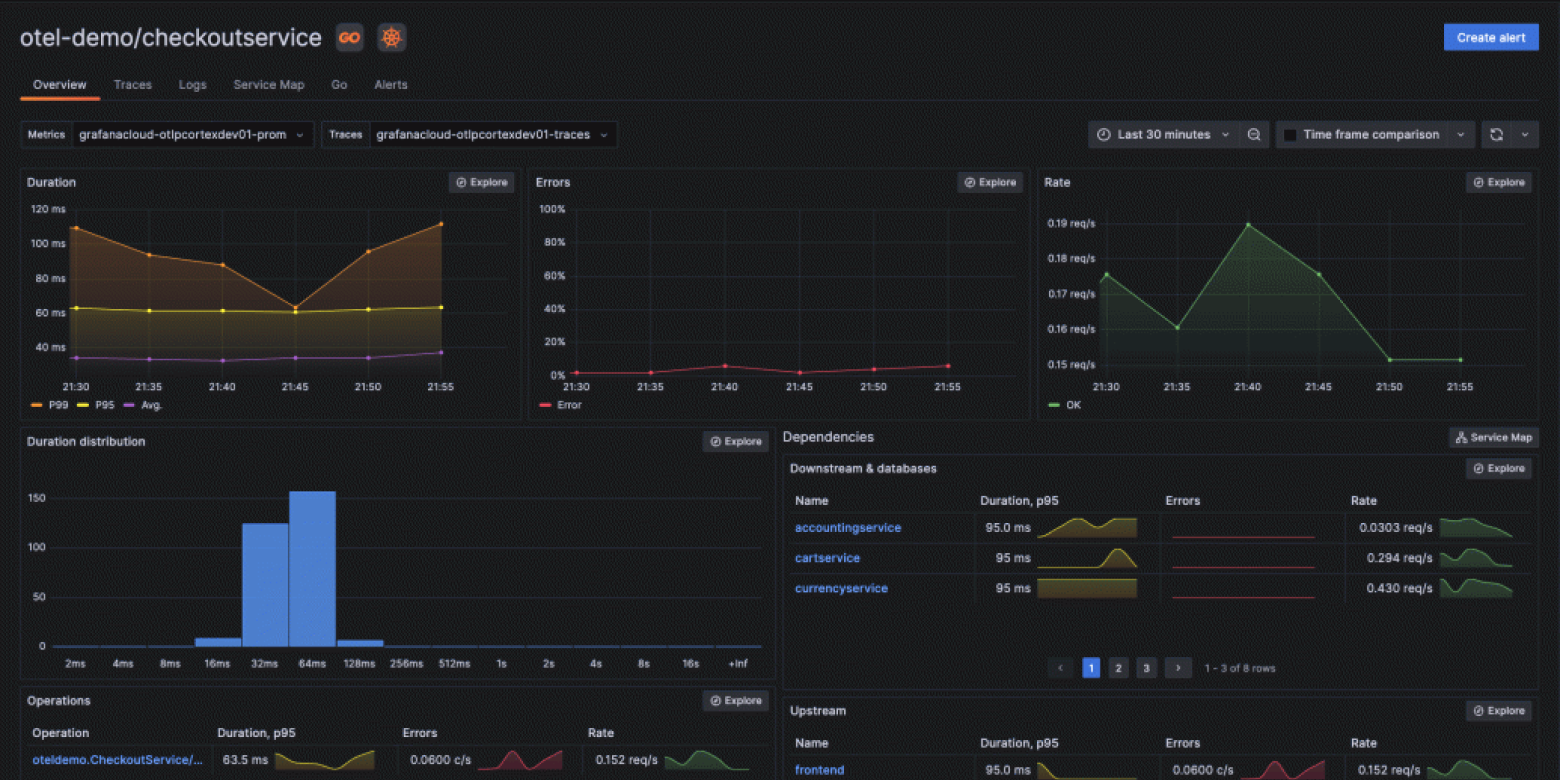
Application Observability
Bring together application telemetry from the frontend and infrastructure layers with native support of both OpenTelemetry and Prometheus.
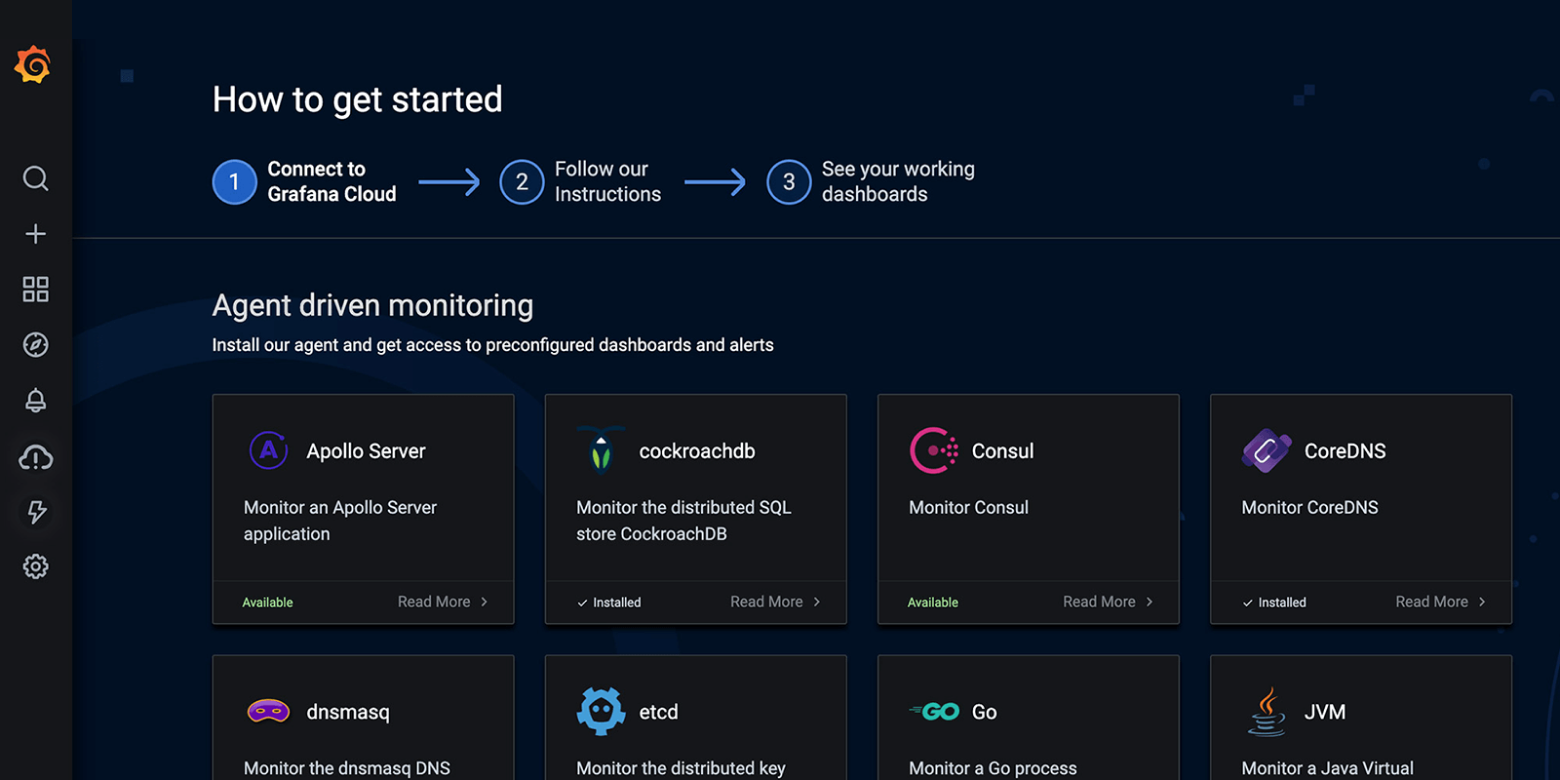
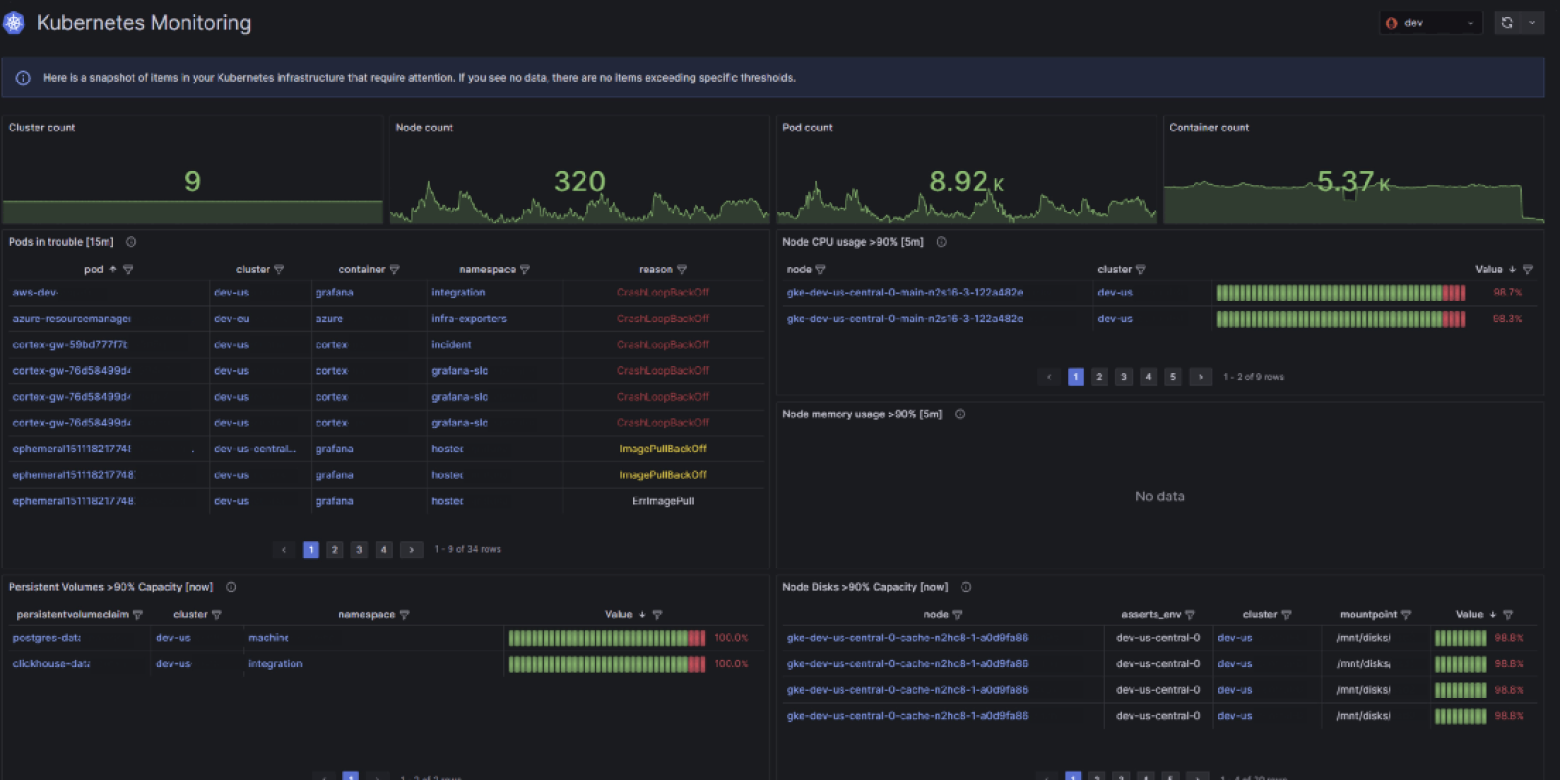
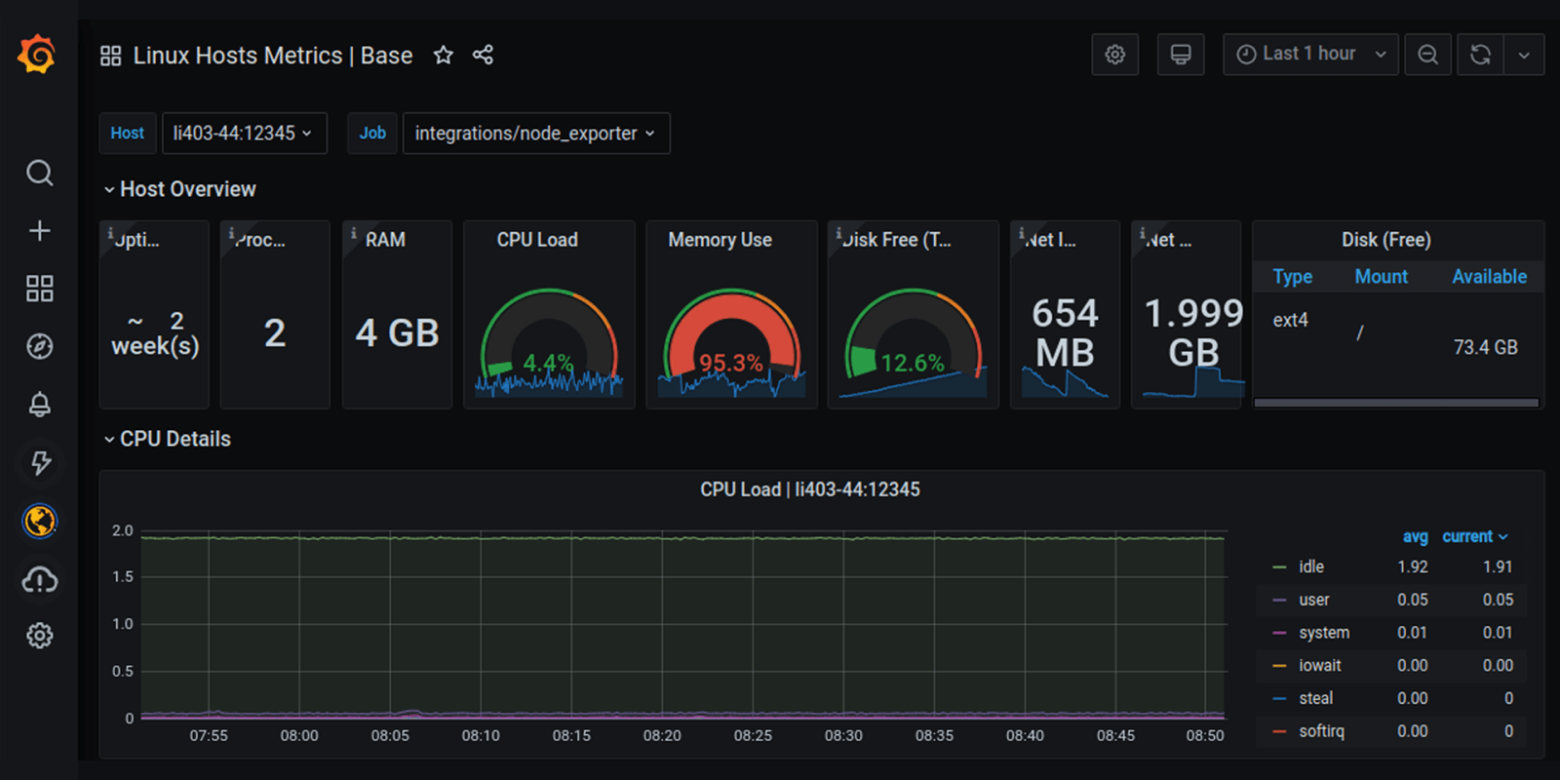
Infrastructure observability
Gain insights into workloads you haven’t been able to see before with pre-built infrastructure observability solutions.
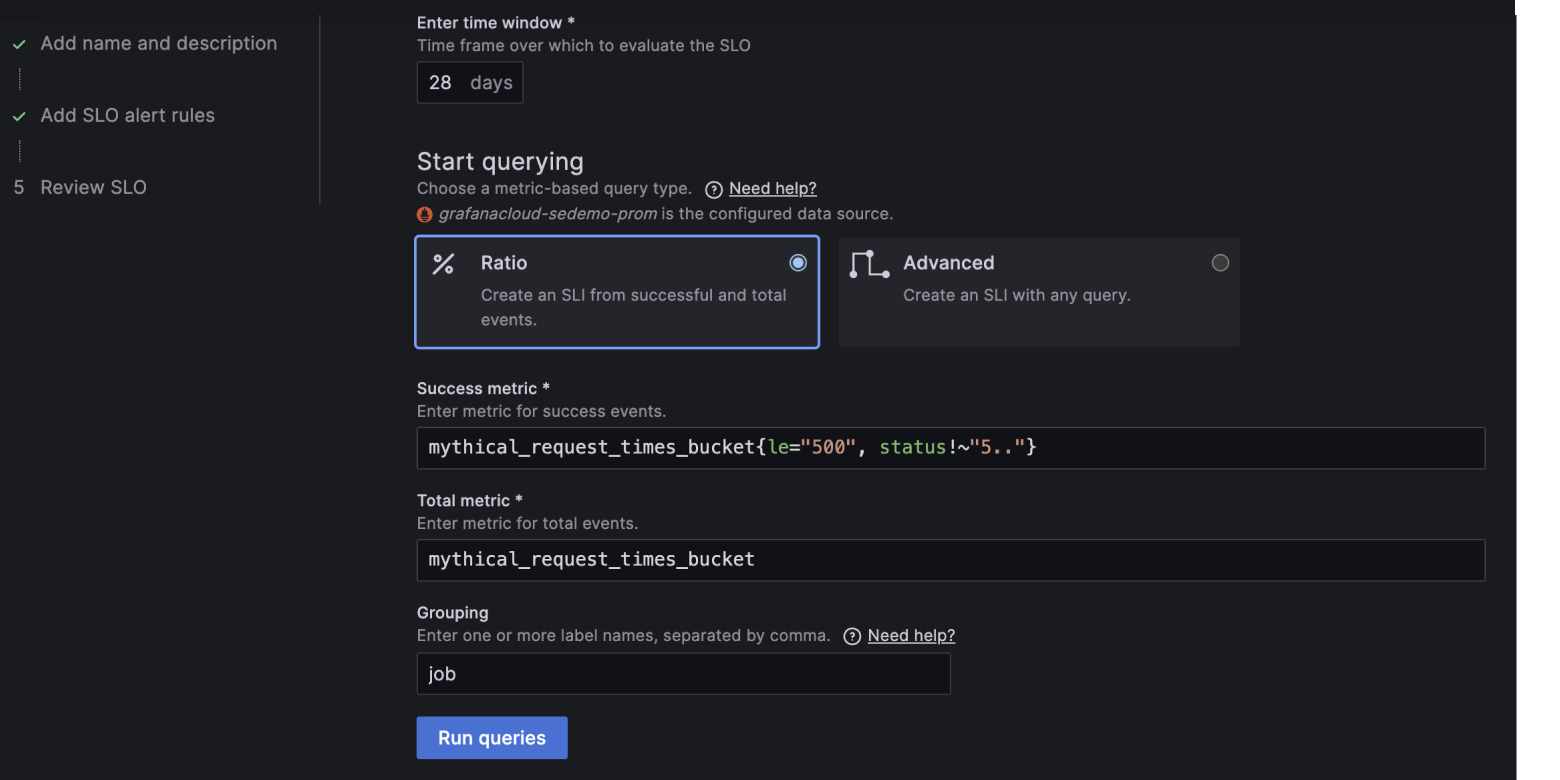
SLO management
Easily create, manage, and scale service level objectives, SLO dashboards, and error budget alerts in Grafana Cloud.
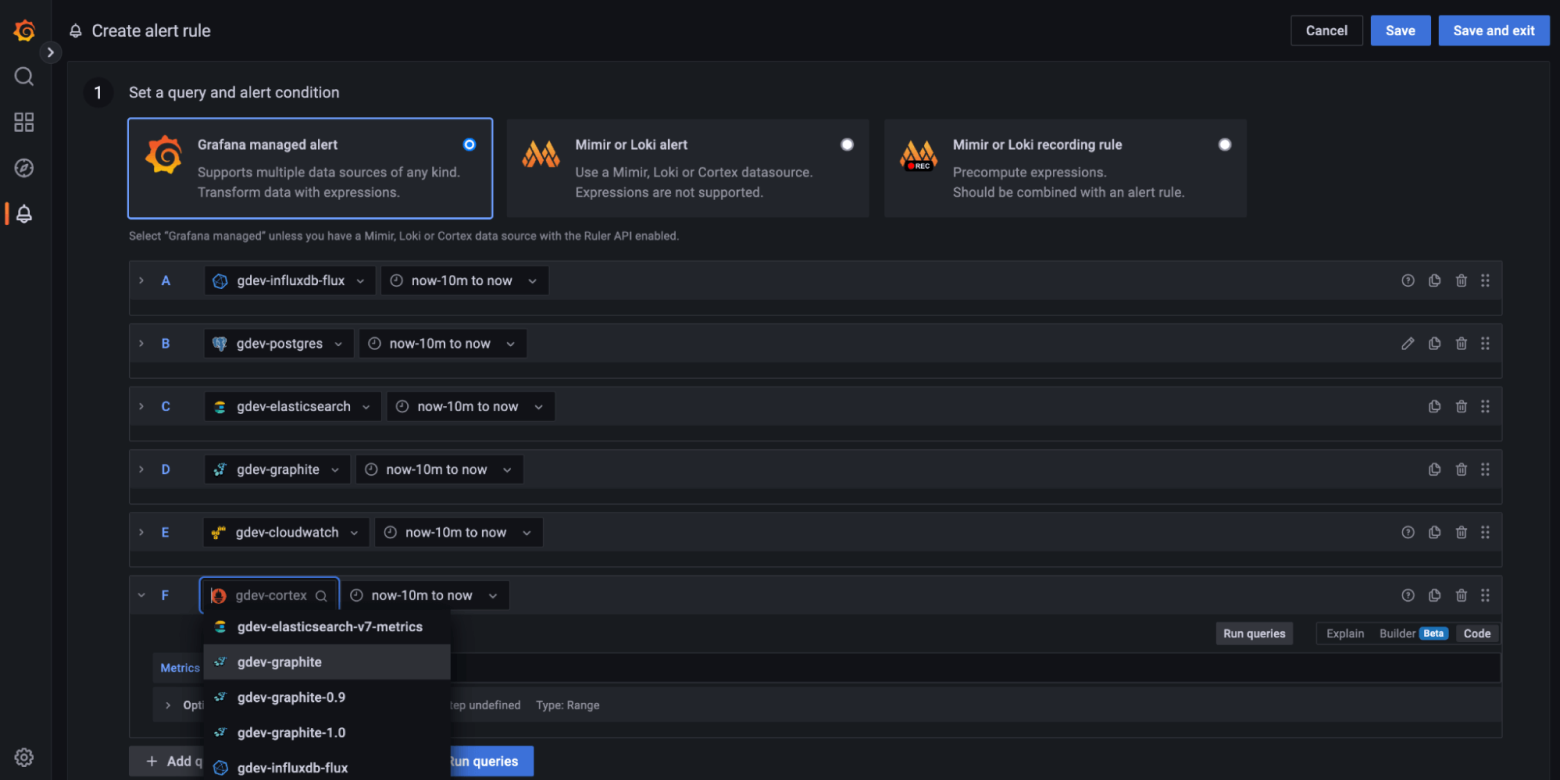
Alerting
Create, manage, and take action on your alerts in a single, consolidated view, and improve your team’s ability to identify and resolve issues quickly.
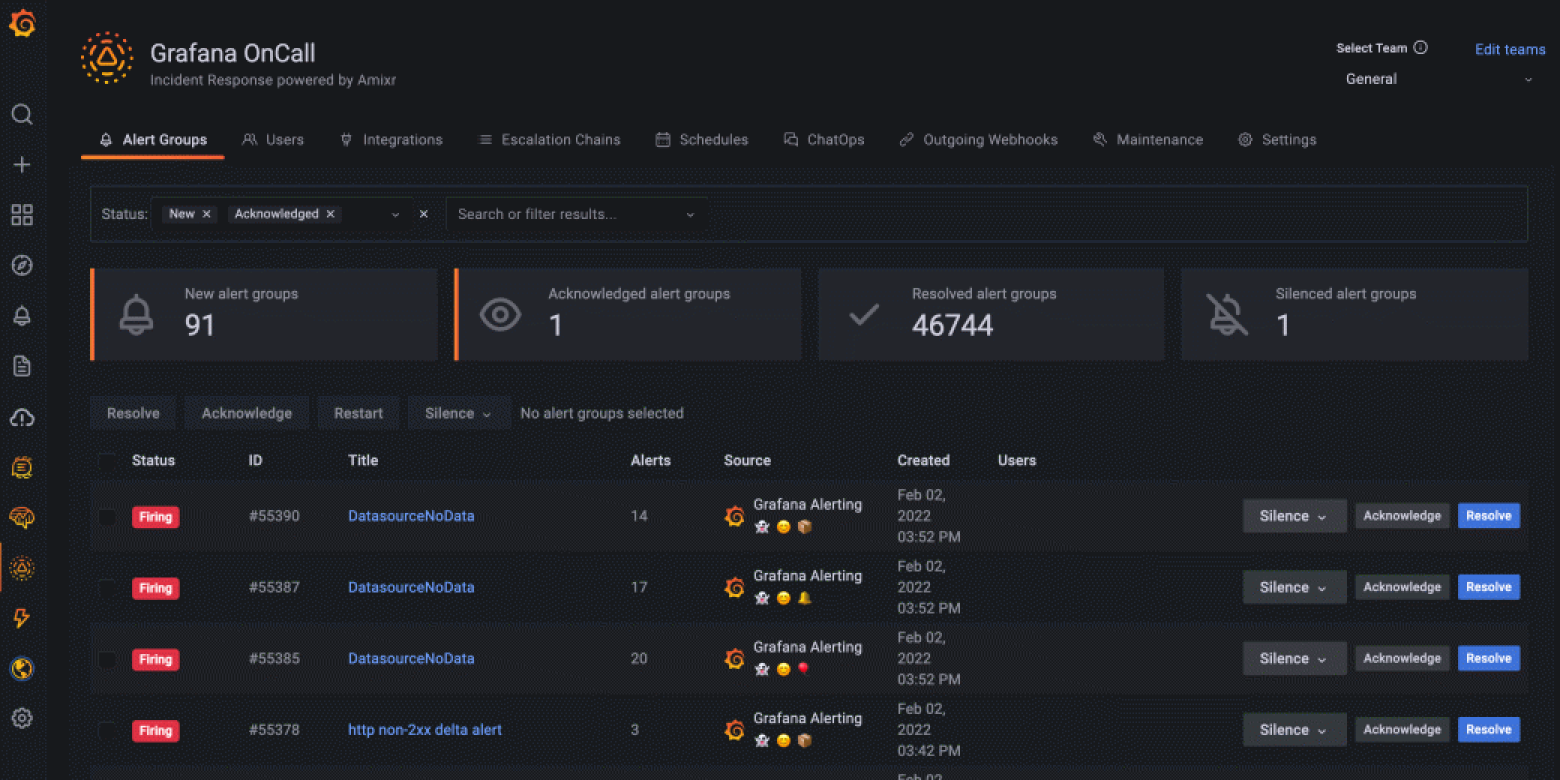
OnCall
Reduce toil in on-call management through simpler workflows and interfaces that are tailored specifically for engineers.
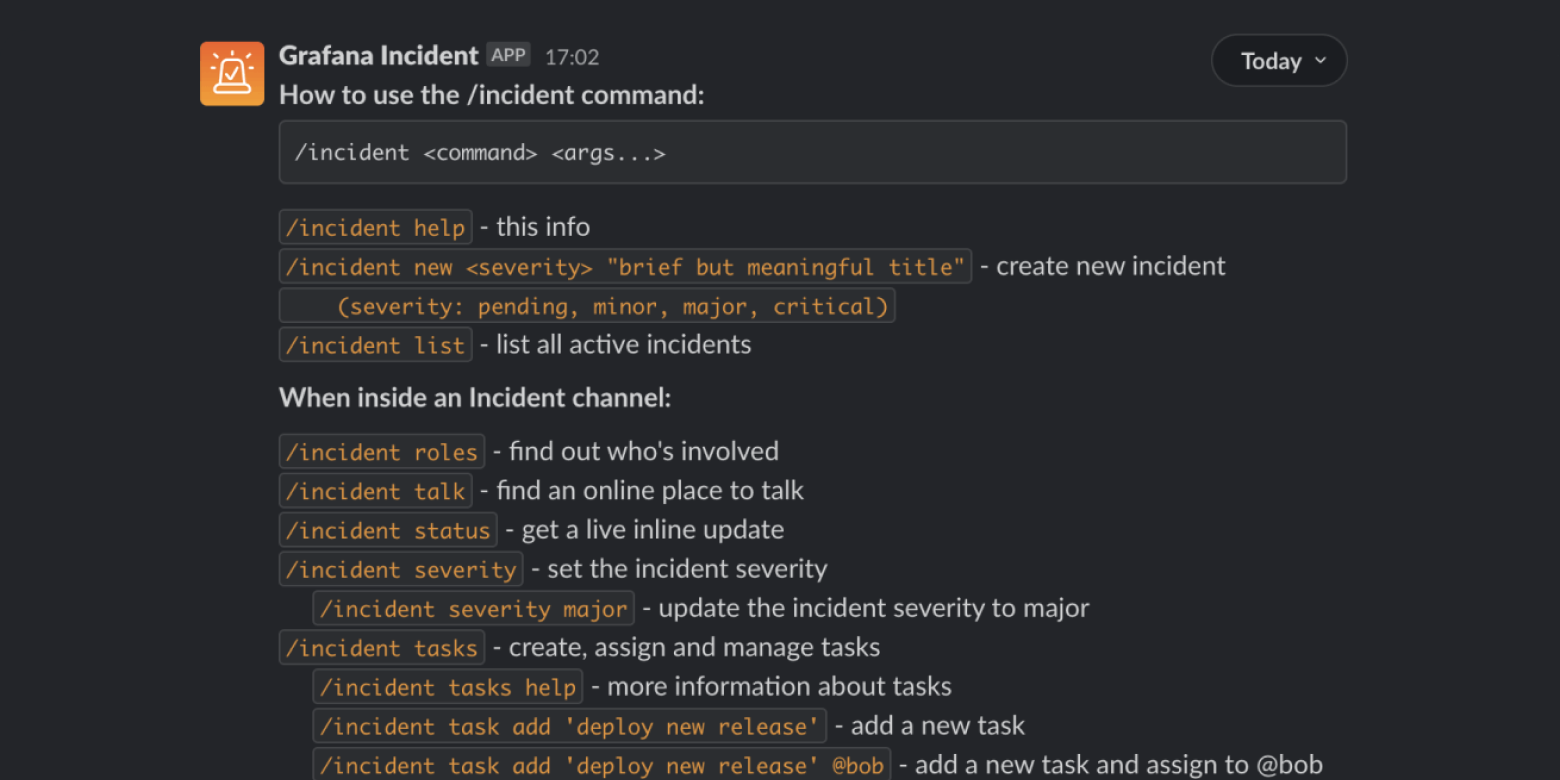
Incident
Respond to incidents faster by automating the toilsome tasks of incident management, which helps you focus on actually fixing the issue.
AI/ML insights
AI/ML tools in Grafana Cloud minimize toil and the need for everyone in your organization to have the same deep domain knowledge about your increasingly complex stack.
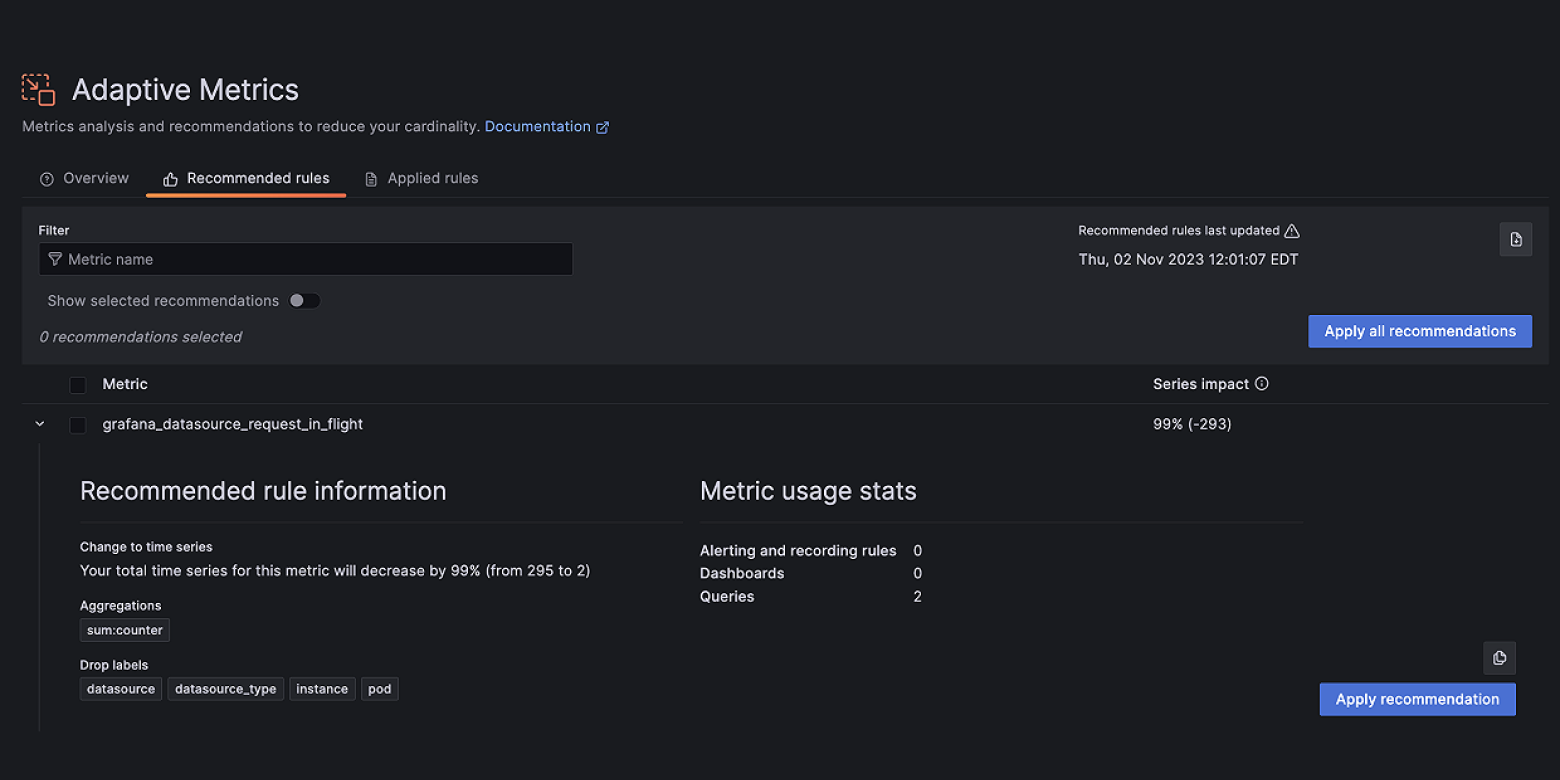
Cost management
Manage, control, and optimize your observability spend with a centralized suite of tools in Grafana Cloud.
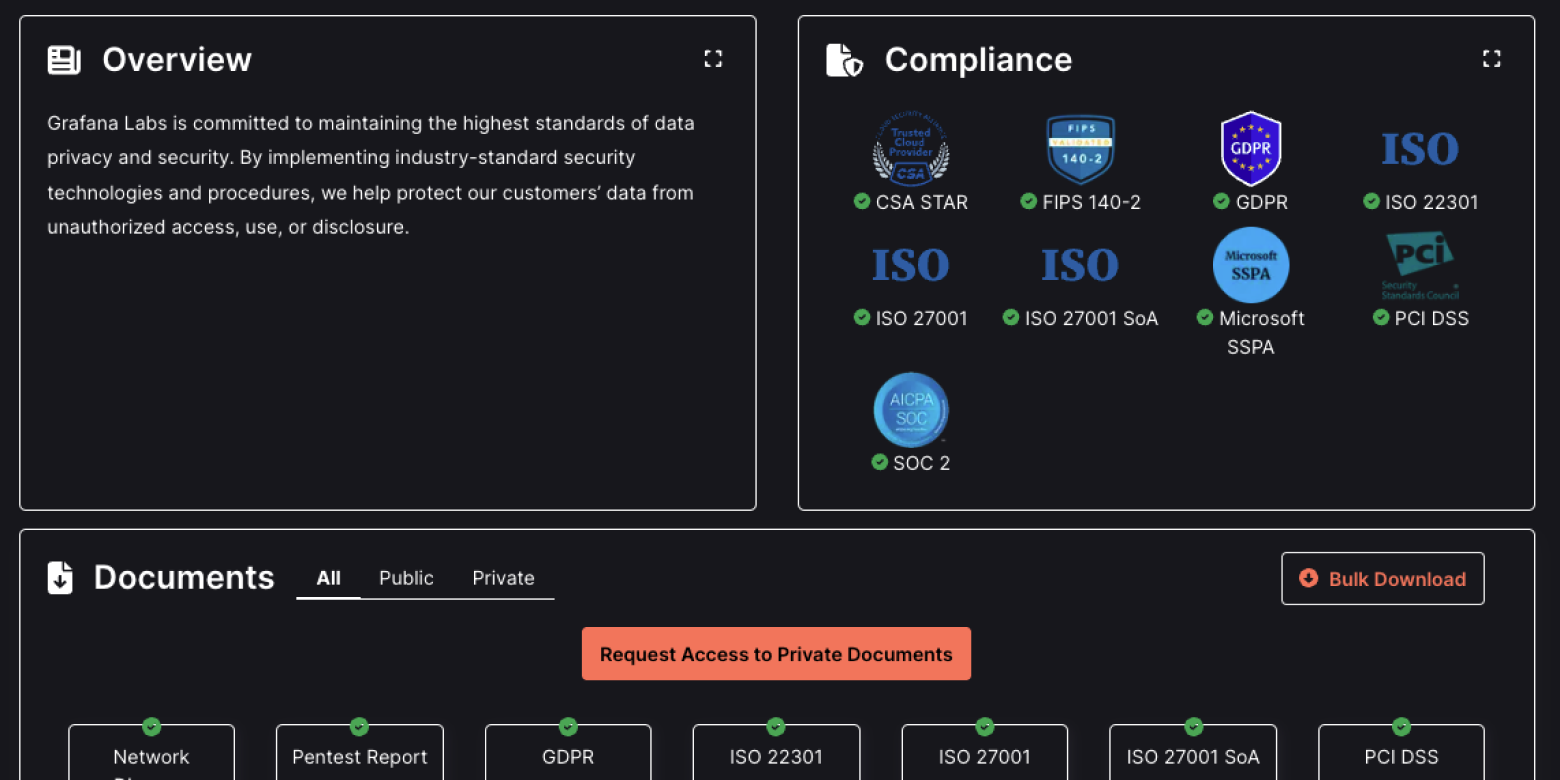
Security and governance
Grafana's security and governance capabilities include robust user authentication and authorization, data source permissions, audit logging, and compliance with industry standards to ensure secure and controlled access to data visualizations and dashboards.
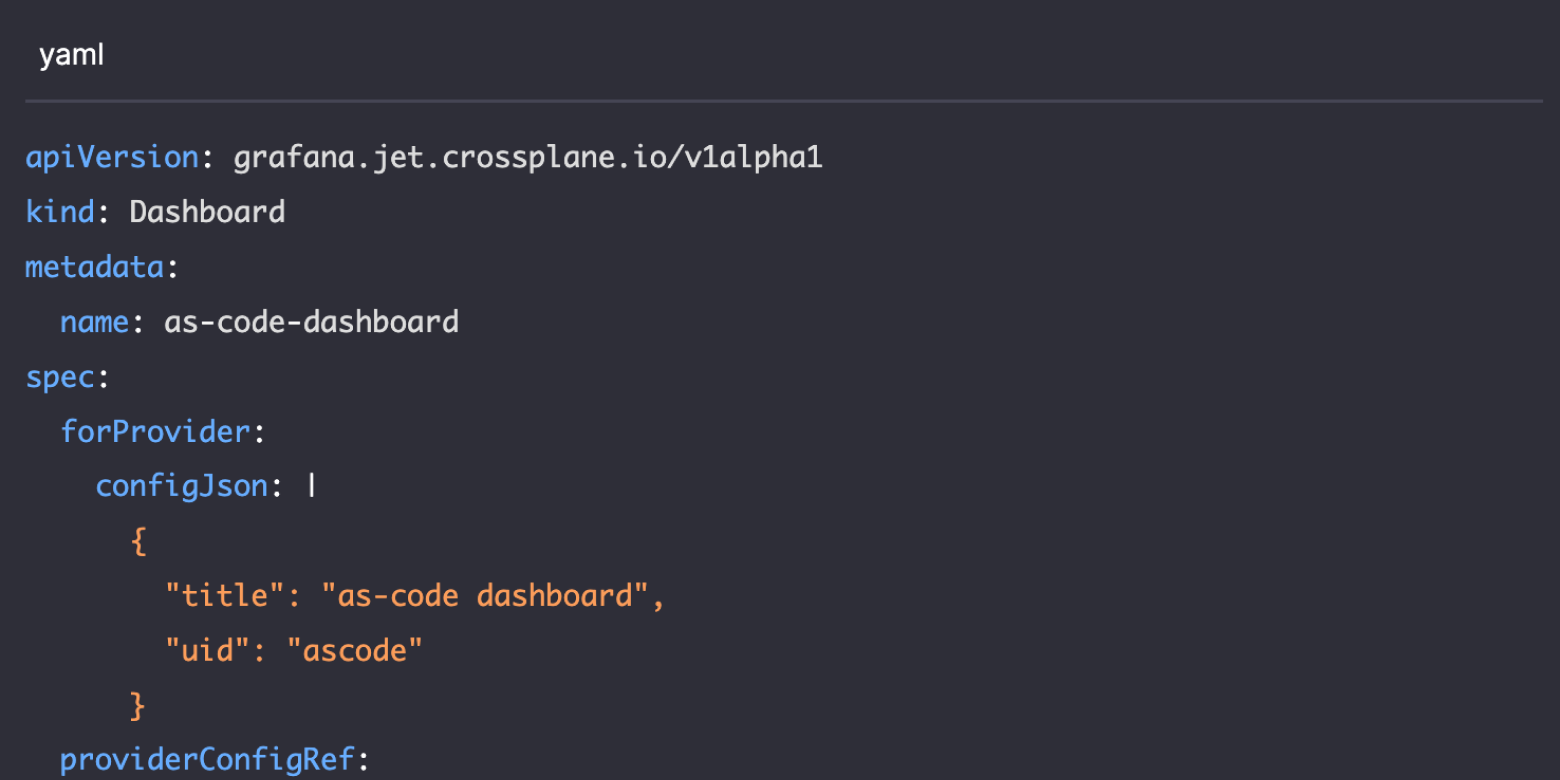
Configuration (as code)
Manage dashboards, datasources, and configurations through declarative JSON or YAML files, enabling version control and automated deployments for consistent and reproducible monitoring environments.
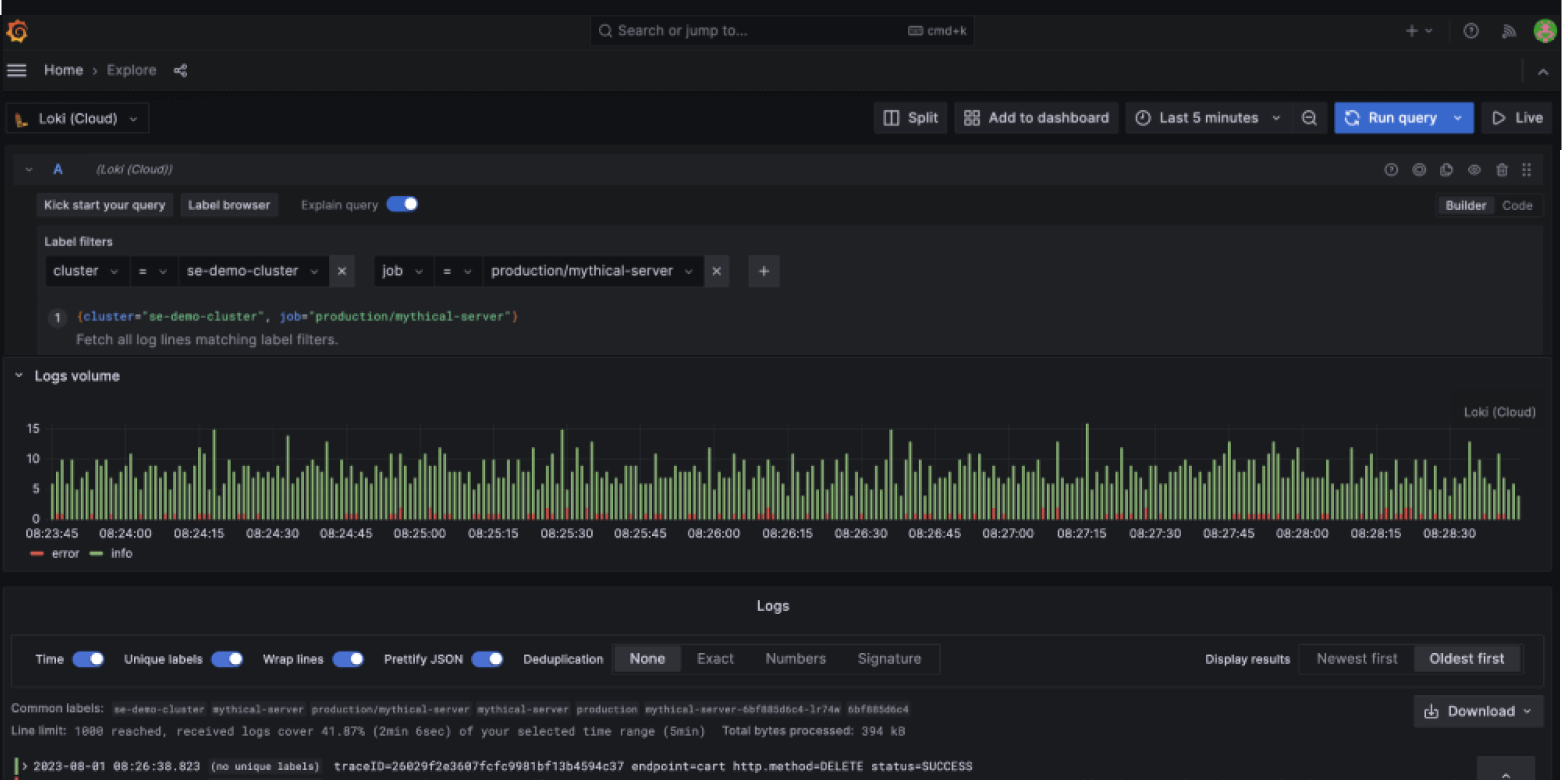
Loki
Store and query logs from all your applications and infrastructure – without worrying about log volumes, costs, or storage limits.
Grafana
Query, visualize, alert on, and understand your metrics no matter where they are stored. Create, explore, and share beautiful dashboards with your team and foster a data-driven culture.

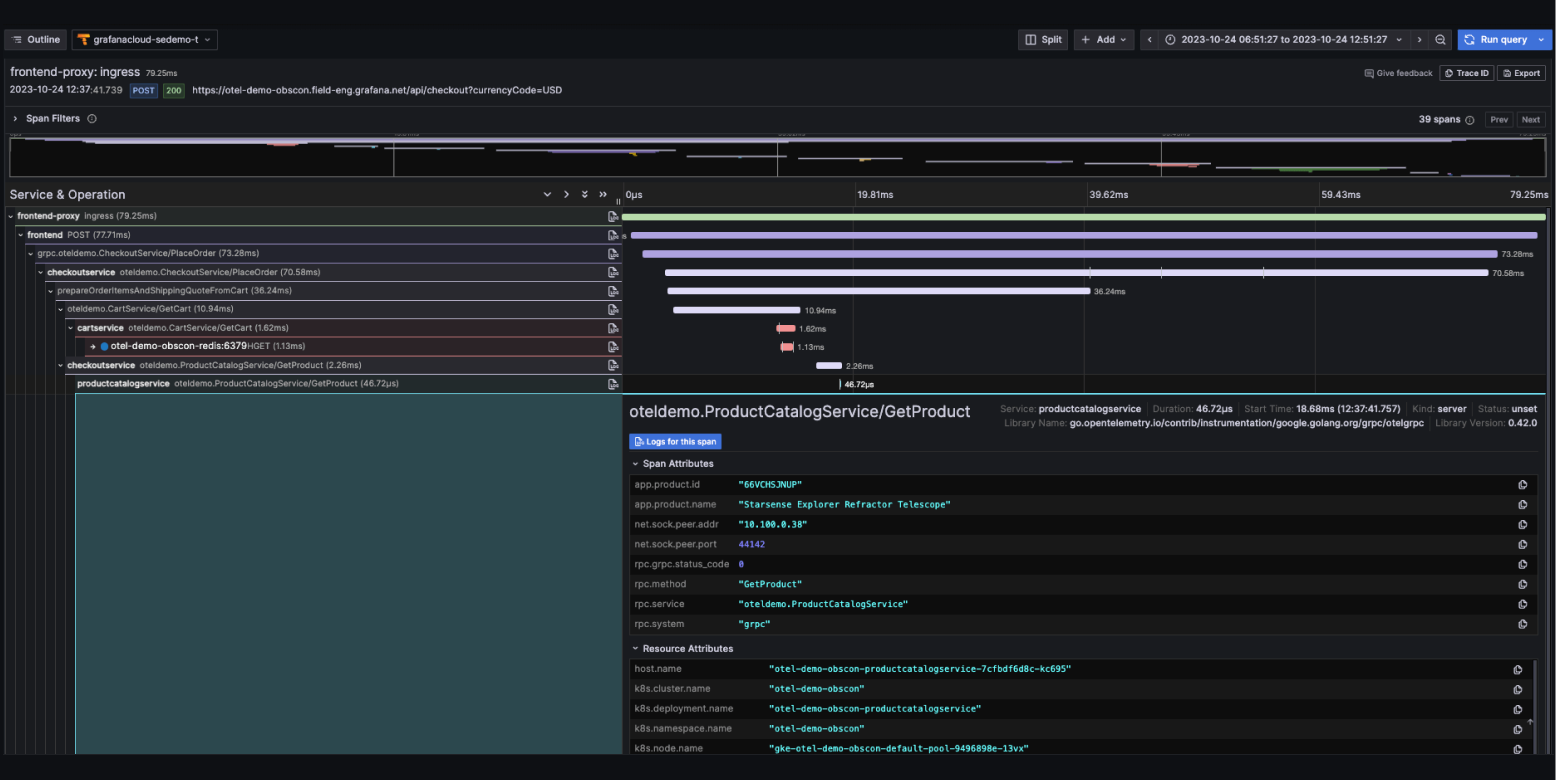
Tempo
Understand the flow of requests and data in your software systems and track down issues quickly with this highly scalable, cost-effective trace storage and query engine.
Mimir
Bring together the raw, unsampled metrics for all your applications and infrastructure, spread around the globe, in one place. Query high-cardinality data with blazing fast PromQL and Graphite queries.
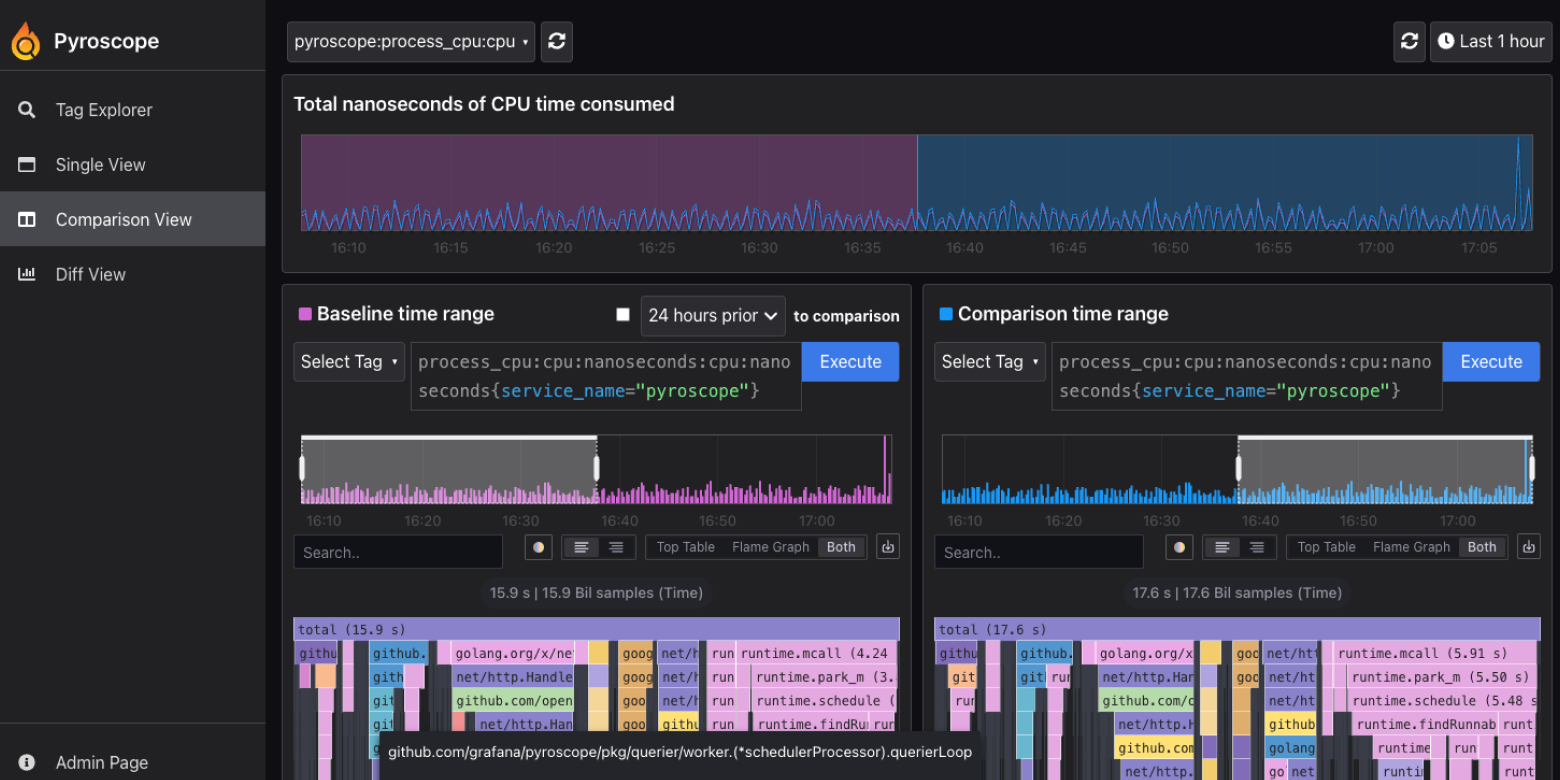
Pyroscope
Optimize infrastructure spend, simplify debugging, and enhance application performance through continuous profiling.
Play around with the Grafana Stack
Experience Grafana for yourself, no registration or installation needed.
Upcoming and recent events
Grafana Labs Blog
News, announcements, articles, metrics & monitoring love