Configure Kubernetes Monitoring with easy deployment and Helm chart
The easy deployment process using the Kubernetes Monitoring GUI works in conjunction with the most recent version of Grafana Kubernetes Monitoring Helm chart. To learn how the Helm chart configuration works, refer to Helm chart overview.
Note
Configuration with the Grafana Kubernetes Monitoring Helm chart is the recommended method.
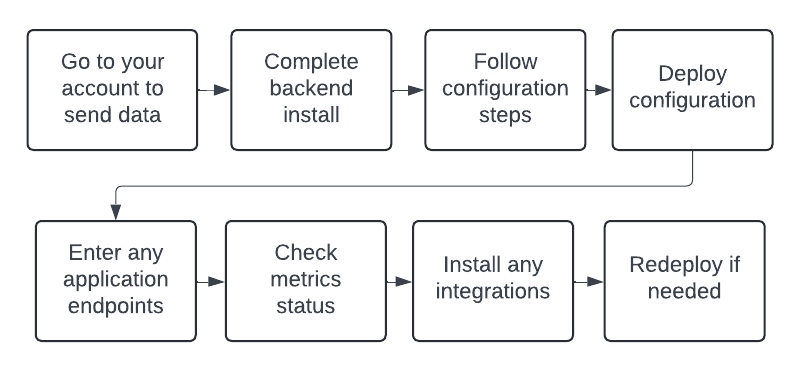
Configuration of the Grafana Kubernetes Monitoring Helm chart includes the steps shown in the following diagram:

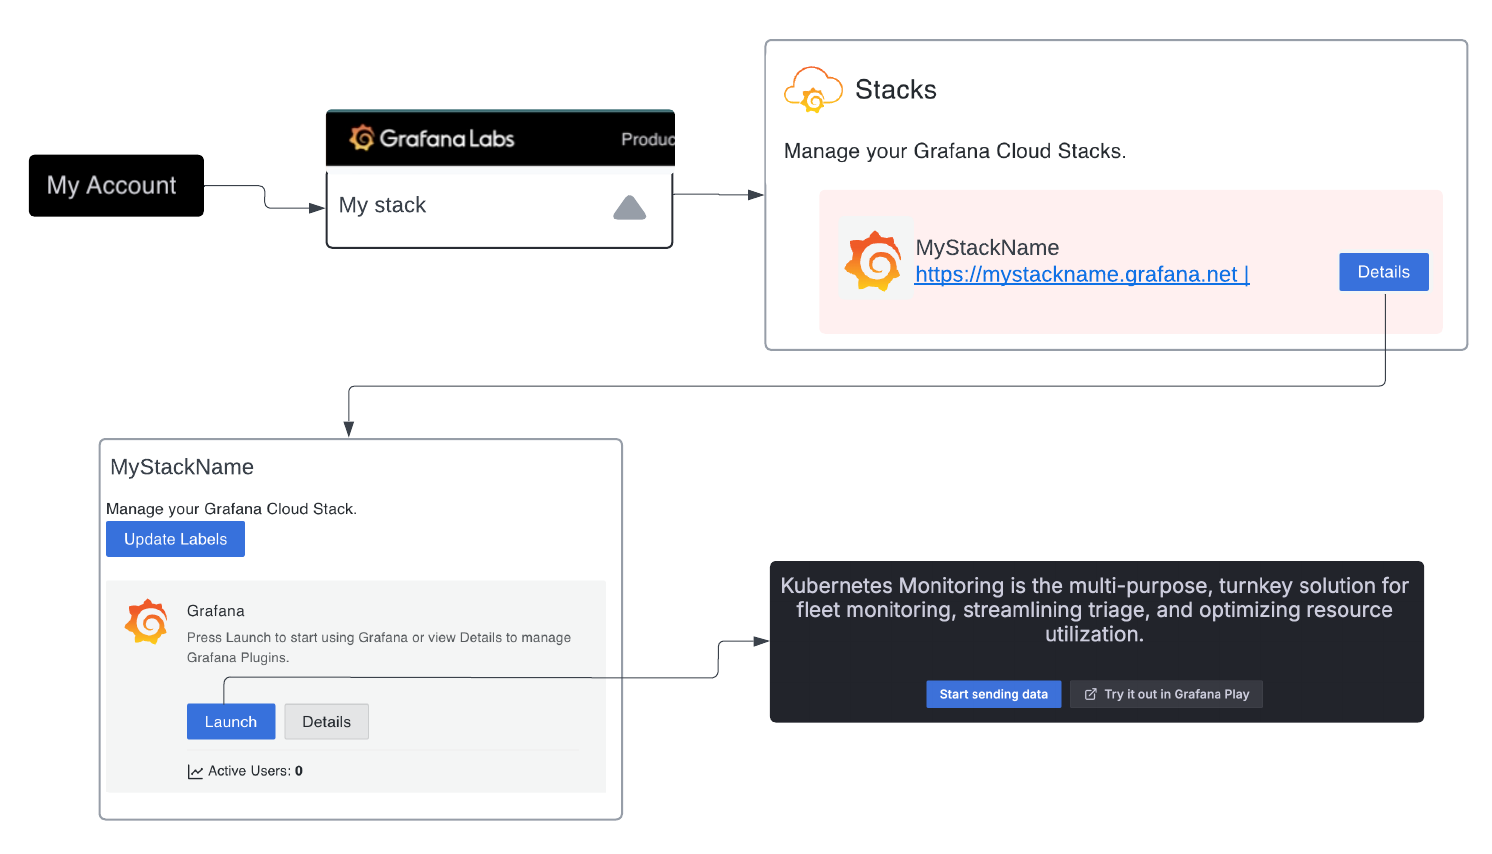
Send data from your account
If you need to send data to your account, complete the following steps:

- Go to your Grafana Cloud account, and click My Account.
- Select your stack.
- Click Details next to the name of your stack.
- At your stack page, click Launch to open Kubernetes Monitoring.
- Click Start sending data.
Kubernetes Monitoring displays the Cluster configuration tab of the Configuration page.
Configuration process
Complete the configuration process on the Cluster configuration tab.
With Grafana Play, you can explore and see how it works, learning from practical examples to accelerate your development. This feature can be seen on this Configuration page.
Before you begin
Make sure you have met the prerequisites required for these configuration steps. To deploy Kubernetes Monitoring with the Helm chart, you need:
- The Admin role to install alerts
- A Kubernetes Cluster, environment, or fleet you want to monitor
- The
kubectland Helm command-line tools - Appropriate versions of items related to:
- kube-state-metrics: Uses
client-goto communicate with Clusters. For Kubernetes client-go version compatibility and any other related details, refer to kube-state-metrics. - OpenCost: Requires Kubernetes 1.8+ clusters.
- Storage visualizations: Require Helm chart release v1.5.1 or greater
- kube-state-metrics: Uses
Backend installation
Click Install to install the required, preconfigured alert rules and recording rules. These recording rules are the source of the workload data in the Kubernetes Monitoring. If you aren’t seeing the workload data, the most likely cause is that the recording rules and alert rules haven’t been installed.
Select features and enter Cluster information
Cluster name: In the Cluster name box, enter the name of your Cluster.
Namespace: In the Namespace box, replace
defaultwith the namespace where you want to deploy your monitoring infrastructure. This is the namespace for Grafana Alloy and other dependencies such as kube-state-metrics.Platform: Select the platform you are using.
- Kubernetes, including Amazon Elastic Kubernetes Service (EKS) on Amazon Elastic Cloud Compute (EC2) and Google Kubernetes Engine (GKE)
- Amazon EKS on AWS Fargate. Node Exporter metrics are disabled. Instead, the Kubernetes API is used to collect Pod logs.
- Azure Kubernetes Service (AKS)
- Google Kubernetes Engine (GKE) Autopilot. Node Exporter metrics are not supported on this platform.
- IBM Cloud Kubernetes Service
- Red Hat OpenShift
Data collection for infrastructure metrics and logs: Switch on or off the following options.
- Cluster metrics on the infrastructure
- Cost metrics
- Energy metrics
- Cluster events
- Automatic discovery with annotations, to collect metrics from Pods and Services using annotations that define their scrape target
- Prometheus Operator objects, for collecting metrics from PodMonitors, Probes, and ServiceMonitors
- Cluster Events
- Node logs, to capture journald logs from the Nodes
![Options for monitoring Cluster and applications Section of quick configuration to select features, including what data to collect]()
Options for monitoring Cluster and applications Data collection for containerized application monitoring: Switch on or off the following options.
- Pod logs
- Application receivers, to receive data from the receivers OTLP/gRPC, OTLP/HTTP, and Zipkin
- Grafana Application Observability, to collect host metrics required by Application Observability
Caution
If you enable Application Observability, this may affect your billing. Refer to Host-based pricing for more details.
- Metrics and traces of inbound and outbound calls to deploy Grafana Beyla for automatic instrumentation of applications on the Cluster
Caution
If you enable automatic instrumentation with Beyla, this may affect your billing due to additional telemetry ingestion.
- CPU profiling, to collect profiles from applications on the Cluster
Use a Grafana.com access policy token
You can create a new access policy token or use an existing token. Refer to Grafana Cloud Access Policies for more information.
To use an existing token:
Click Use an existing token.
Paste the token into the Access policy token name box.
To create a new token:
Click Create a new token.
In the box for Access Policy Token name, enter the name of your token.
In the expiration date box, select an option for the expiration date.
The permission scope for the token appears.
![Options for configuration, including expiration date Options for configuration, including expiration date]()
Options for configuration, including expiration date Click Create token.
The token generates and appears in the token box. This token is automatically copied into the ConfigMap file.
Click the copy icon in the token box to copy the token. Make sure to save it in a secure place. It will not be shown again.
Deploy monitoring resources on the Cluster
Deploy the configuration using either the Helm client or Terraform.
Helm client
To use the Helm client to deploy the Kubernetes Monitoring Helm chart to the Cluster:
Copy the command.
Paste and run it in your terminal.
Terraform
To use Terraform to deploy the Kubernetes Monitoring Helm chart to the Cluster:
Copy, modify, and save the following files to your Terraform system set up using Terraform:
provider.tfgrafana-k8s-monitoring.tfvars.tf
Deploy by using the commands
terraform initandterraform apply.
Configure application instrumentation
If you chose to include receivers in the Select features and enter cluster information section, a list of endpoints appear. In your application that generates metrics, logs, or traces, enter the appropriate OTLP or Zipkin address.
Note
If you change the deployment name to something other than grafana-k8s-monitoring, the endpoint address is updated as well. Be sure to update your applications to point to the correct endpoint.
Done
Click the Metrics status tab to view the status of data collection. Your data becomes populated as the system components begin scraping and sending data to Grafana Cloud. This view shows the health of the different sources of metrics, Pod logs, and Cluster events, as well as any applicable version numbers.
Troubleshoot
Refer to Troubleshooting for any issues that occur after configuration.
Install any integrations
You can use Grafana integrations to monitor the health and status of services and applications running in your Kubernetes clusters.
To install a Kubernetes integration to begin scraping metrics:
Click the Integrations tab.
Select the integration for the service you want to monitor.
Select your preferred deployment method (Helm Chart, Agent, or Agent Operator).
Add the provided code snippet to the ConfigMap, or deploy the provided Operator Object. Make sure to replace any template fields with values specific to your service.
Click Install integration. Installed integrations display a green checkmark on their tile.
If you want to use an integration not currently listed on the page, you can use embedded Agent exporters and integrations by configuring them manually. Refer to
integrations_config.After installing an integration, redeploy the configuration using the method you originally used.
Retrieve Helm values
If you installed Kubernetes Monitoring with the Helm CLI, you can retrieve the values for your configuration by using the helm get values command.


