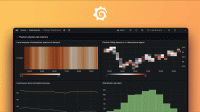
Visualize incident data
Note: Incident Insights is currently in the Experimental release stage. Grafana Labs offers support on a best-effort basis, and breaking changes might occur prior to the feature being made generally available.
Incident Insights allows you to monitor your incident data so you can discover key metrics and trends about your organization’s incident response performance.
Using Incident Insights, you can:
- Evaluate valuable response metrics with a pre-built dashboard.
- Build custom dashboards using the Grafana Incident data source.
- Duplicate and customize the dashboard template to fit your needs.
- Filter and explore your incident metrics based on labels, severity, and more.
- Embed your incident response metrics into your existing Grafana dashboard ecosystem.
Before you begin
- Incident Insights is included with Grafana IRM at no additional cost, regardless of your Grafana Cloud tier. If you’re not already using Grafana Cloud, create a free account to get started.
When installing Incident Insights, the following actions are performed automatically:
- Configuration of the Grafana Incident data source
- Generation of a new service account and token with viewer permissions
- Creation of the pre-built Insights dashboard containing your incident metrics
Although the data source ships automatically with the most recent version of Grafana Incident, it is not configured by default.
Set up Incident Insights
- In your Grafana Cloud stack, click Alerts & IRM in the left-side menu
- Find Incident in the left-side menu and click Insights
- Click Set up Insights dashboard
- Once complete, you should be redirected to the Insights dashboard and be able to explore your metrics.
Once set up, the Grafana Incident data source and Incident Insights are ready to use. To revisit the Insights dashboard simply click Insights in the left-side menu again.
Dashboards
While Insights provides some of the most common incident response metrics, every organization has unique needs and workflows. You can build your own dashboards to visualize your incident data using the Grafana Incident data source.
To create a new dashboard using the Grafana Incident data source, follow the steps to Create a dashboard.
Query incident data
You can use Grafana Explore to play around with your incident metrics. The data source currently utilizes the same filter expressions you may be familiar with in Grafana Incident. You can reuse any already bookmarked or saved expressions that you’ve used to create your dashboard panels or annotation queries within Grafana Incident.
The Query Editor also recognizes a subset of Grafana Variables to support a more interactive dashboard experience. This allows you to create custom variables that fetch, filter, and hold existing values based on statuses, severities, and labels from Grafana Incident.

Variable queries
Use Grafana Variables to add variables for incident status, severities, and labels. Variables allow you to reference and use labels, status, and severities when creating visualizations and panels.
Example queries
Review the following example queries to get started:
Query for incidents that have either critical severity or the security label attached.
or(severity:critical label:security)Query for incidents with an active status which have been declared within a selected time frame. Learn more at Grafana Variables.
status:active started:${__from:date}, ${__to:date}Query for all resolved incidents that don’t have the label value attached.
status:resolved -label:valueQuery for all resolved incidents that have one of the selected labels.
status:resolved or($labels)Query for all resolved incidents which have a squad:incident or PIR label attached.
status:resolved or(label:'squad:incident' label:PIR)Note: The example above assumes you have already set up a
$labelsvariable which queries Labels from your data source.
Note: Do you have any feedback or bug report related to Insights? Let us know in our grafana/incident-community repo.


