
What's new from Grafana Labs
Grafana Labs products, projects, and features can go through multiple release stages before becoming generally available. These stages in the release life cycle can present varying degrees of stability and support. For more information, refer to release life cycle for Grafana Labs.


Loading...
Area of interest:
Cloud availability:
Cloud editions:
Self-managed availability:
Self-managed editions:
No results found. Please adjust your filters or search criteria.
There was an error with your request.
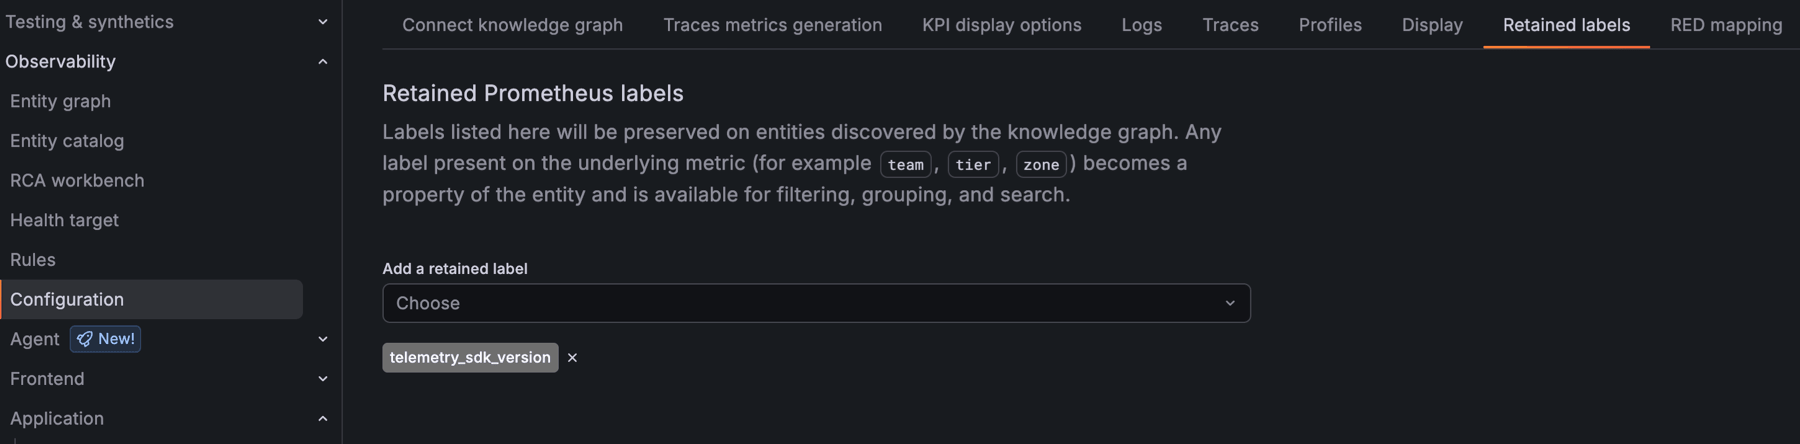
Grafana Cloud Knowledge Graph normalizes your telemetry into a fixed set of well-known labels, which means organization-specific labels like team, region, or cost_center are dropped during processing. With custom label retention, you can choose which of your own labels to keep on knowledge graph entities and recording rules.
Retained labels let you filter, group, and drill down on your own dimensions across the entity catalog, entity graph, and RCA workbench. They also propagate to the knowledge graph’s recording rules in Mimir, so you can use them in dashboards and alerting.
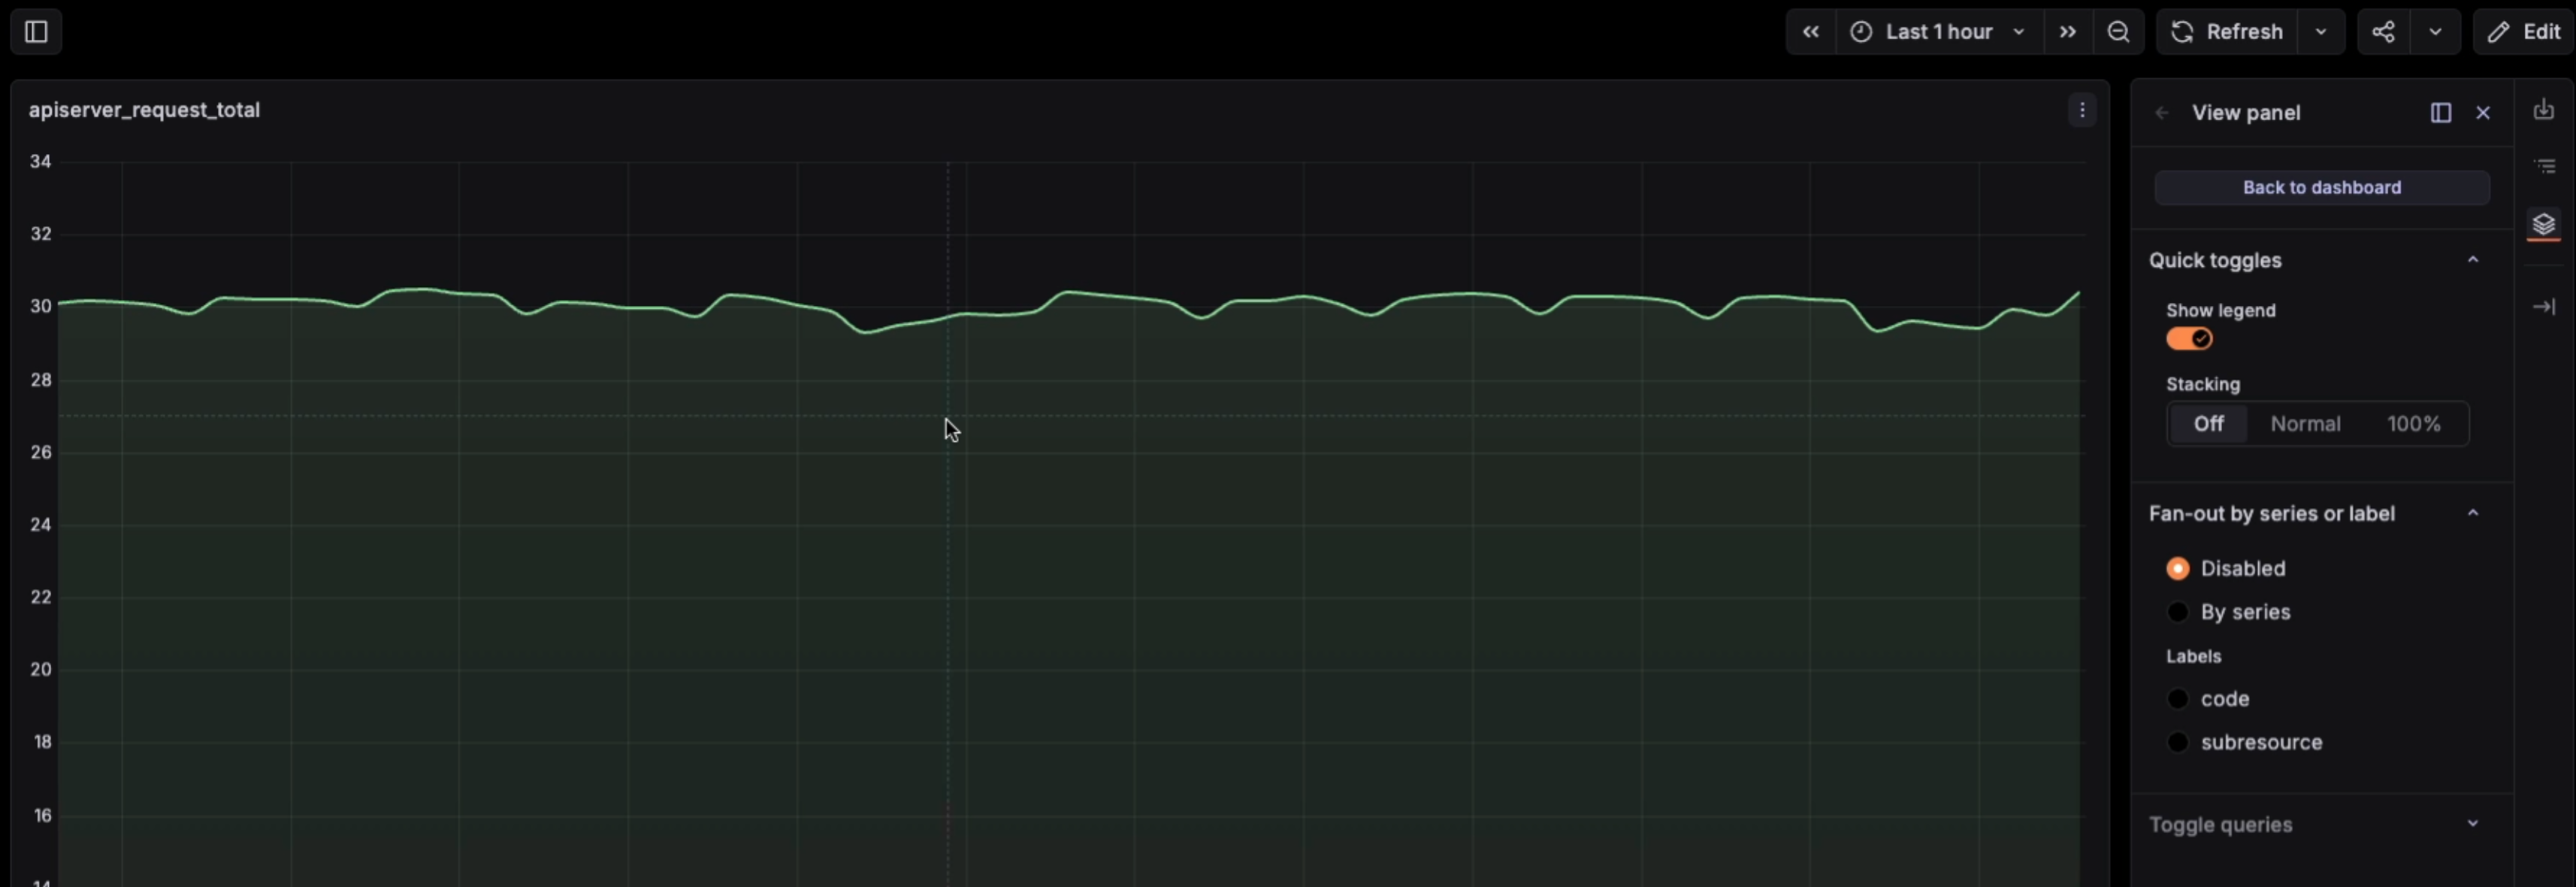
When a graph packs in dozens of series, understanding which ones share an anomaly means visually tracing overlapping lines. Plus, if you’re a viewer, you can’t toggle the legend or stacking to get a clearer look, because those options live in edit mode.
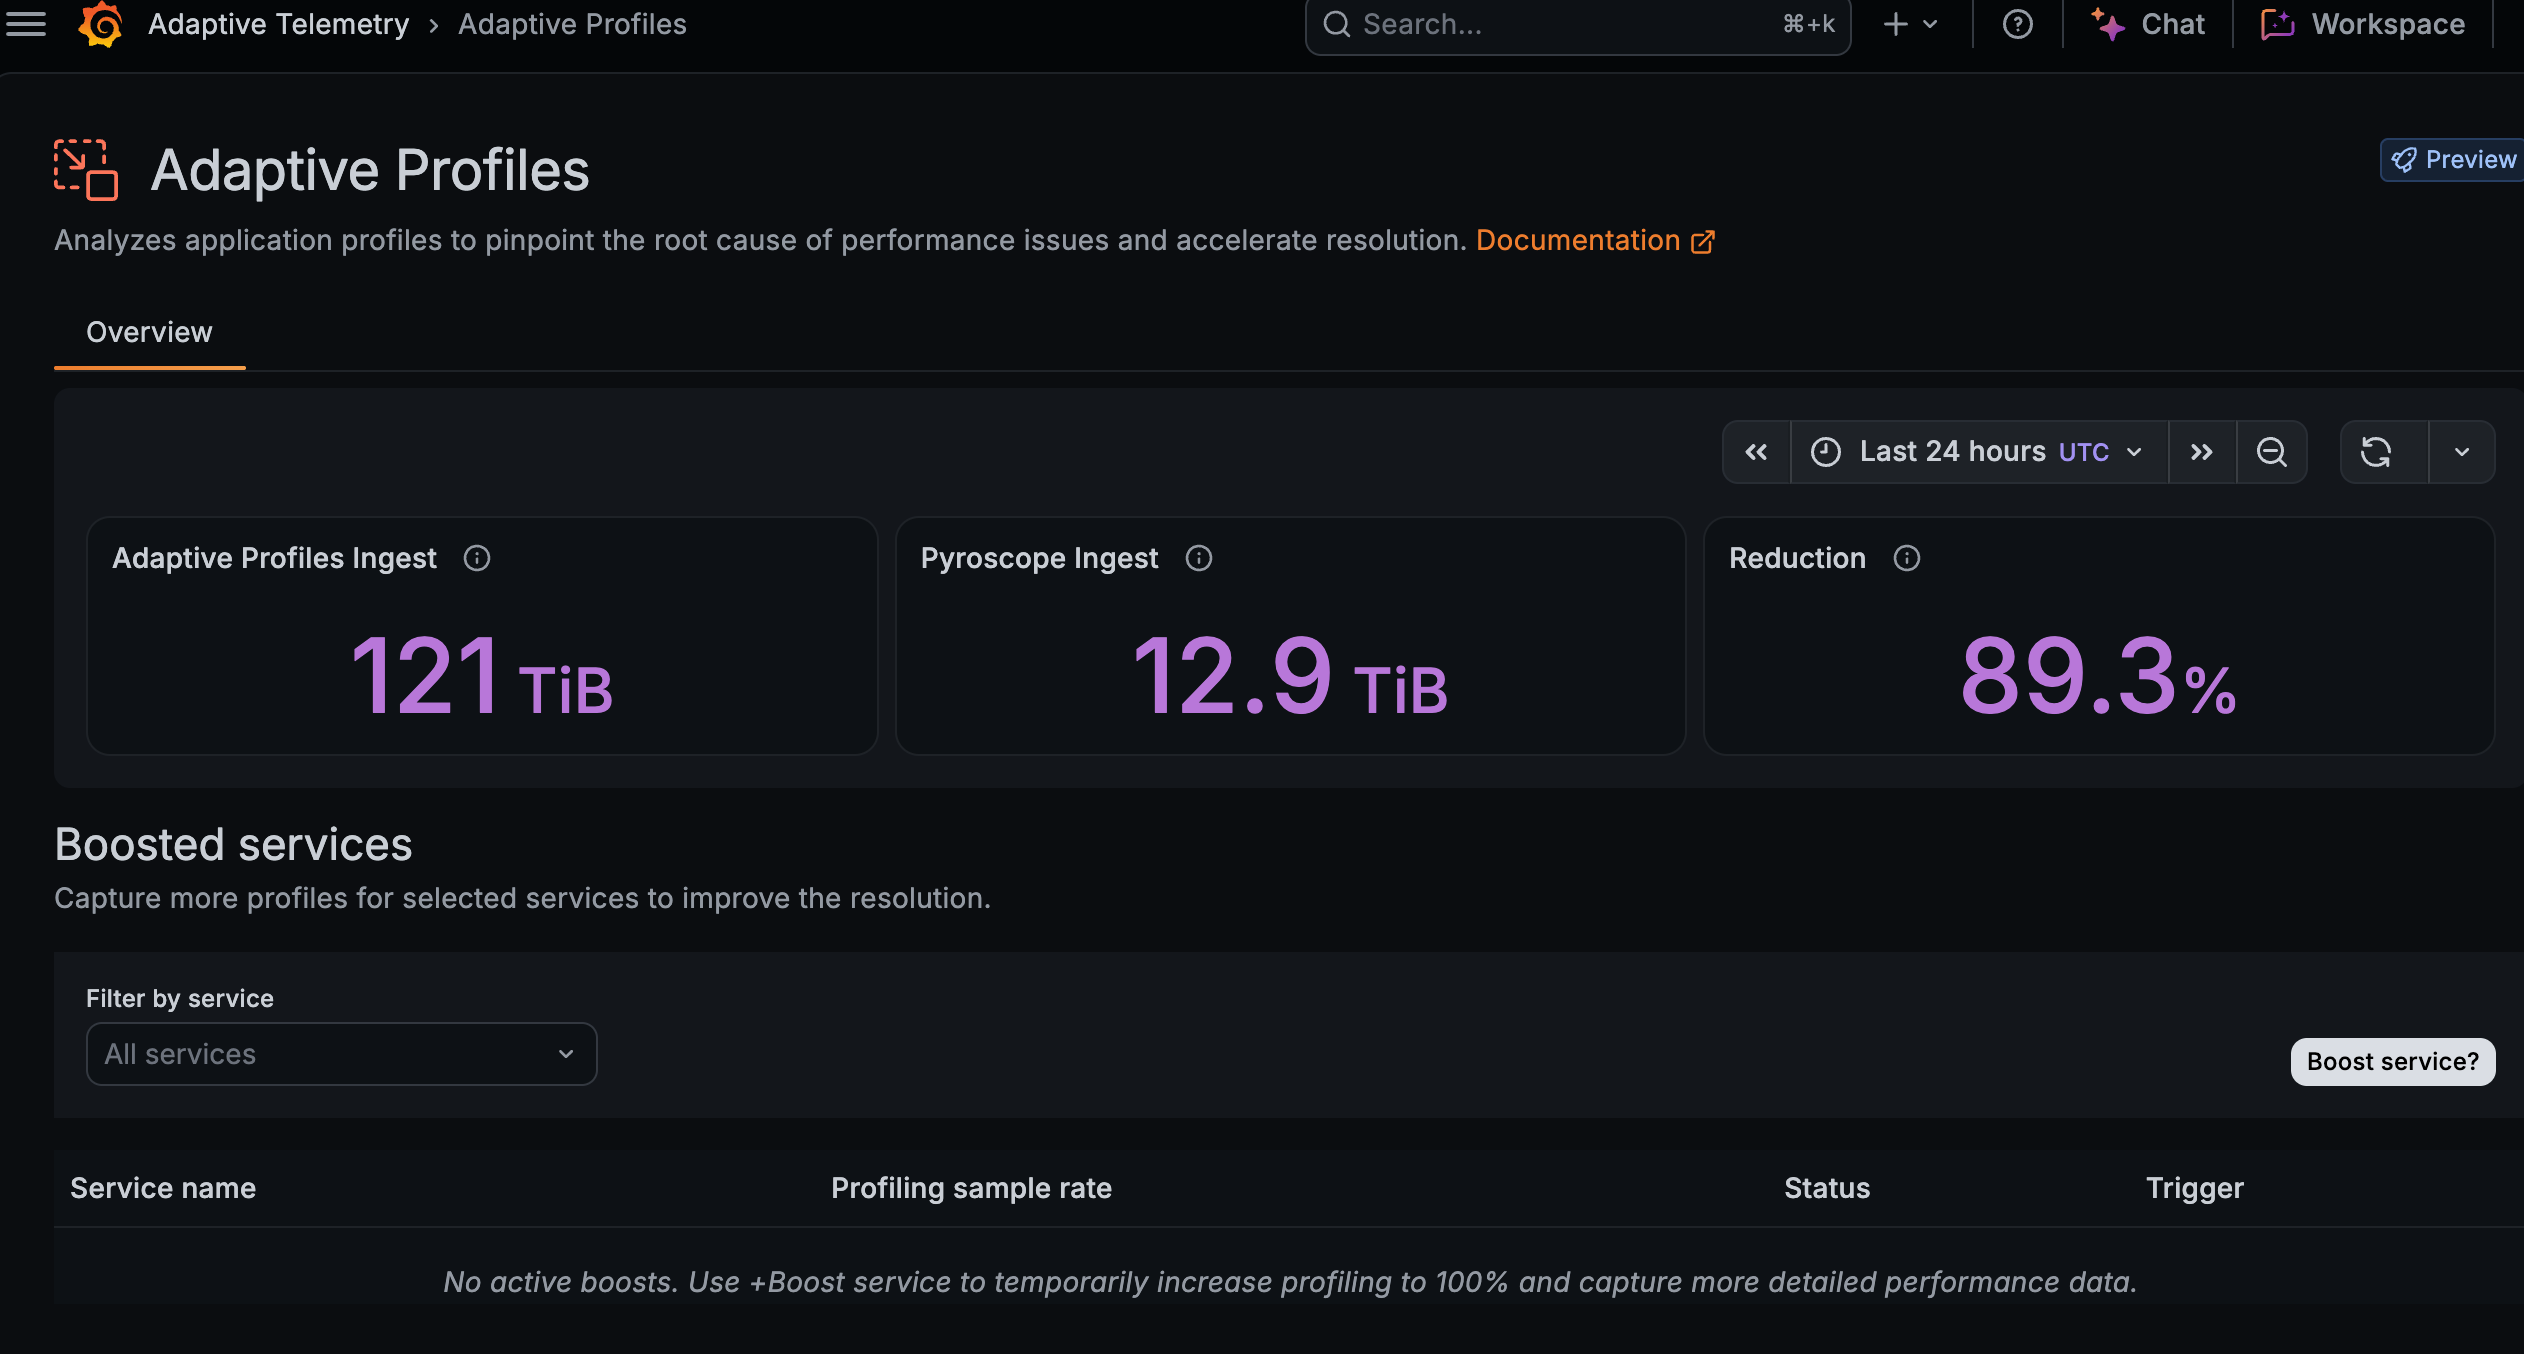
Make distributed profiling cost effective with Adaptive Profiles! Now generally available, Adaptive Profiles applies a cost effective baseline sample rate to your services, increasing the sampling rate to 100% for a service when behavior change is detected. This allows Adaptive Profiles to reduce your stored volume by 85-90%.
Organizing a dashboard is now faster with multi-select grouping. In edit mode, you can select multiple panels at once and instantly group them into a row or a tab, making it easy to restructure dashboards without moving panels one by one.
Session Replay in Frontend Observability records what a user actually did in your app. All clicks, scrolls, and page state is played back to you alongside the errors, logs, and traces Frontend Observability already captures. Instead of guessing what led to a bug report, you can watch the session it happened in.
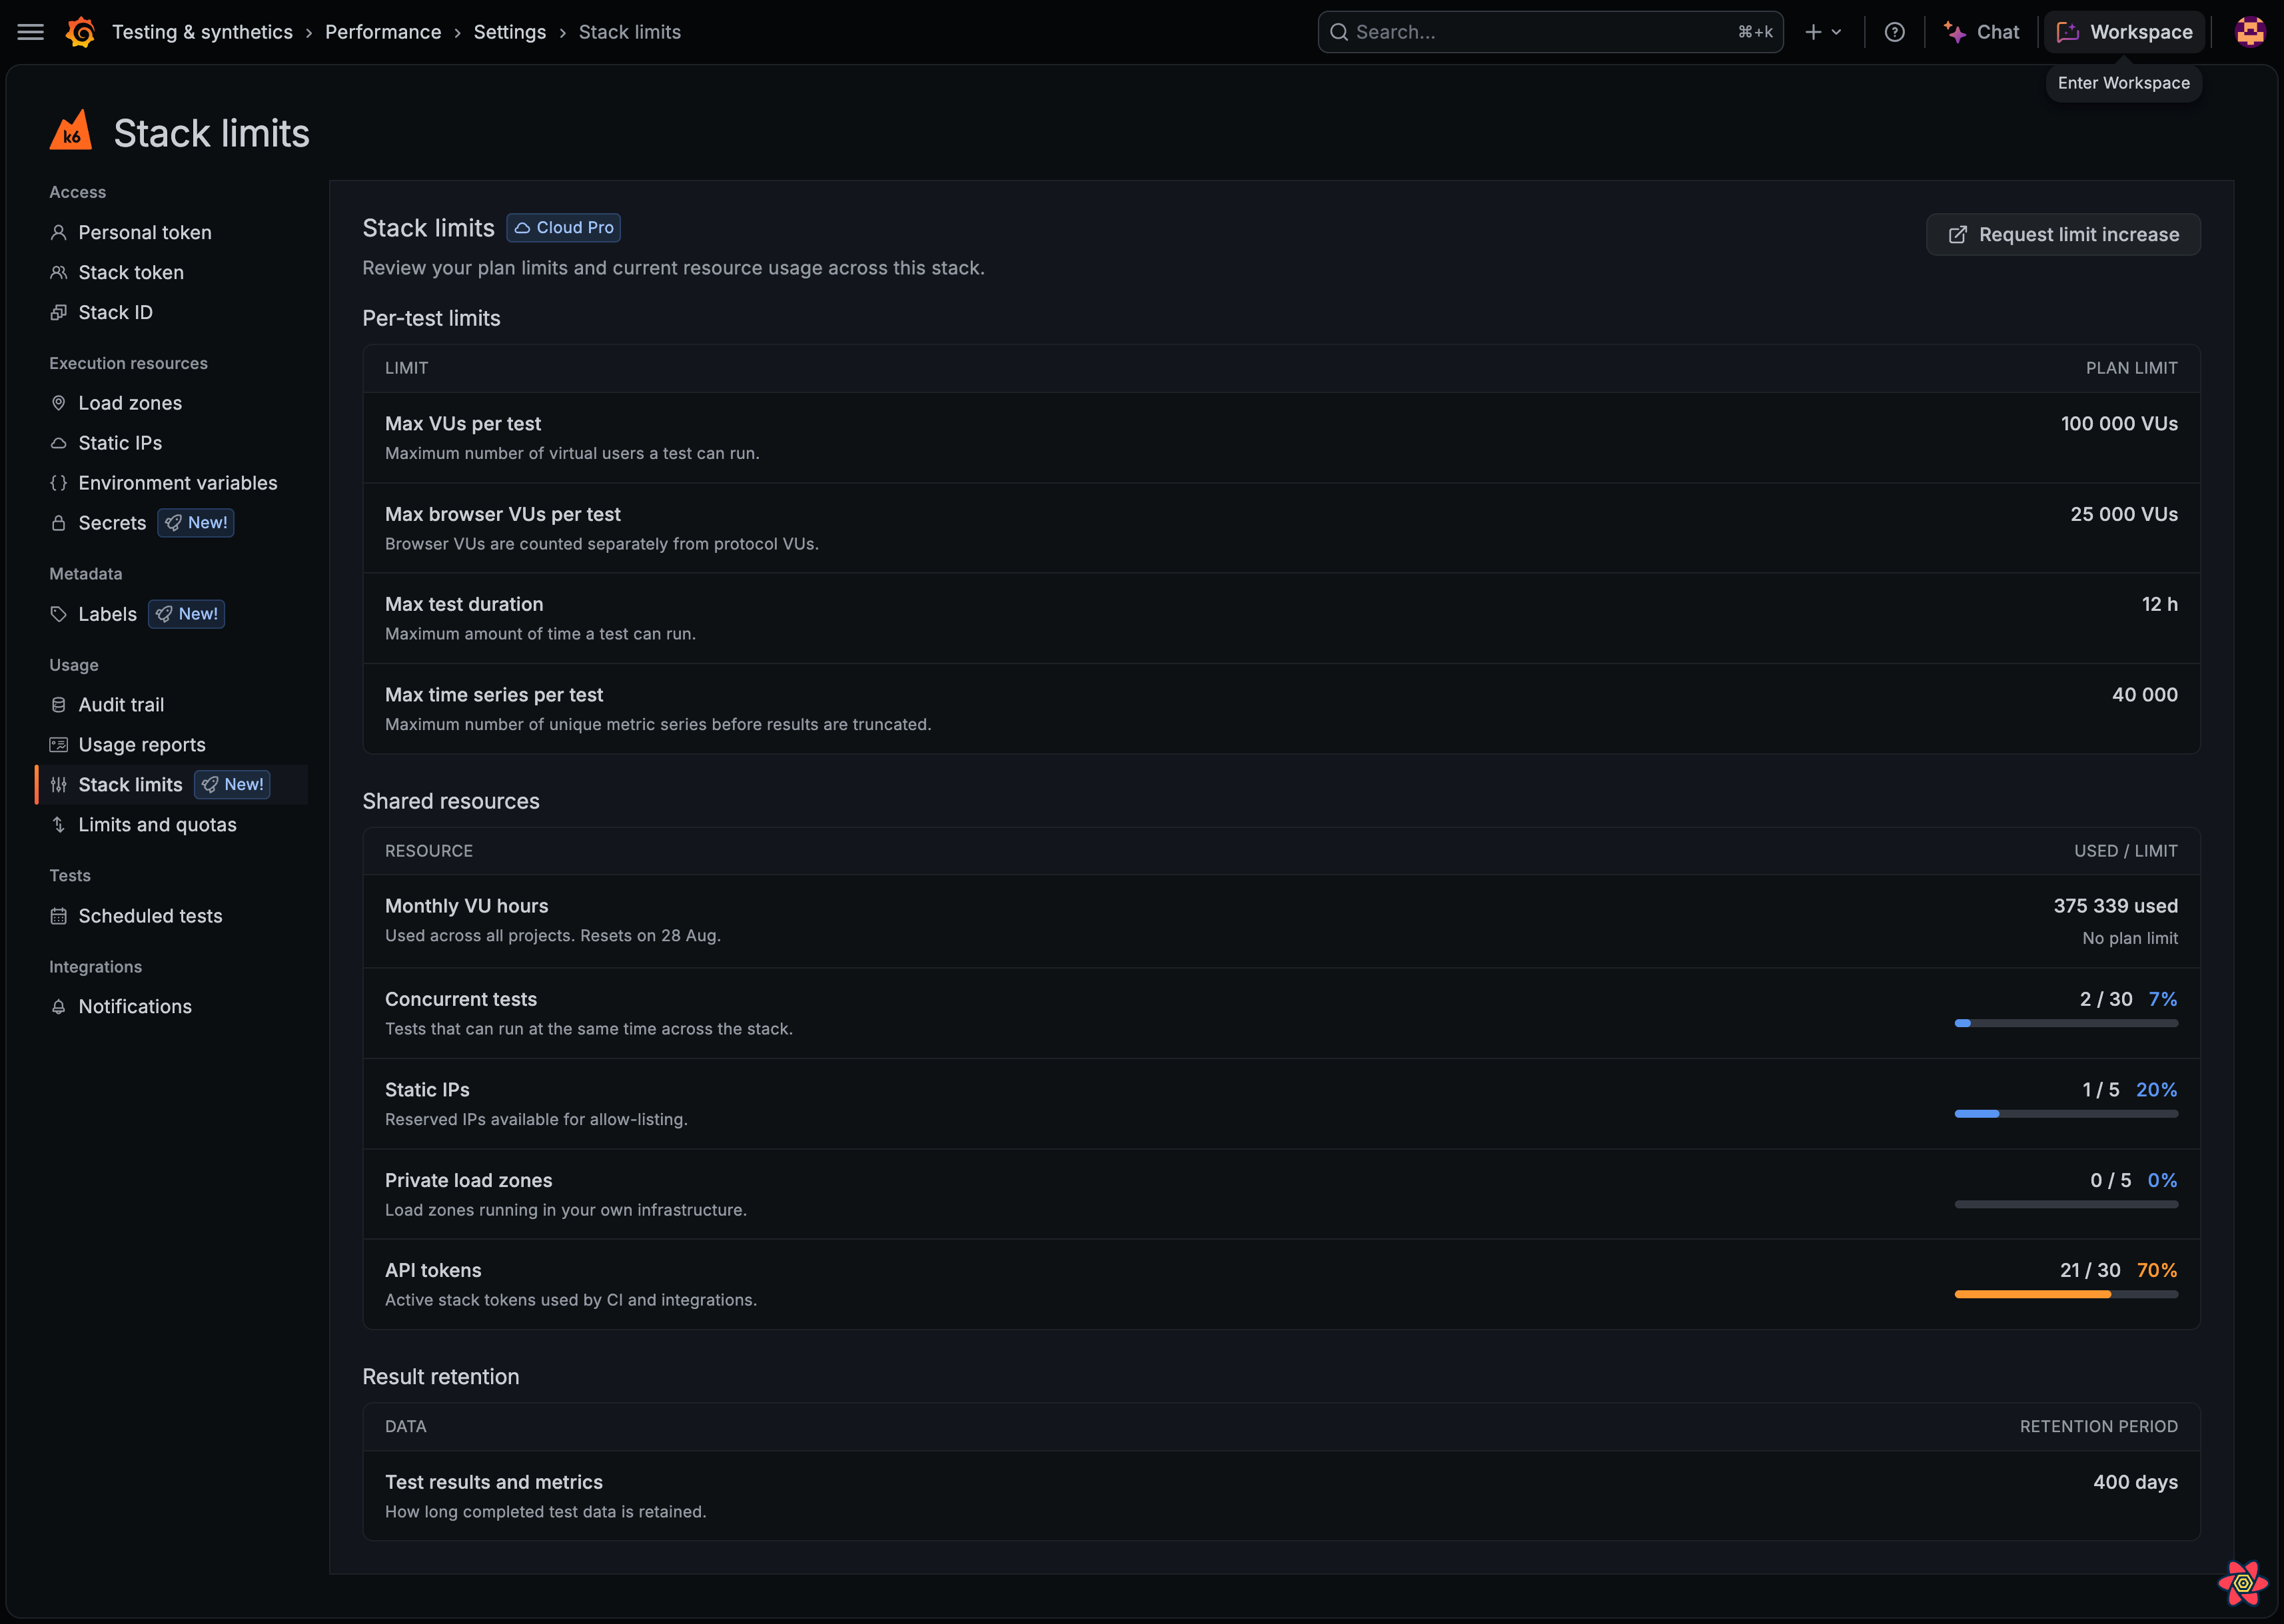
You can see your Grafana Cloud k6 plan limits and current stack usage in one place. That view helps you know what your subscription allows before you run a large test or add shared resources.
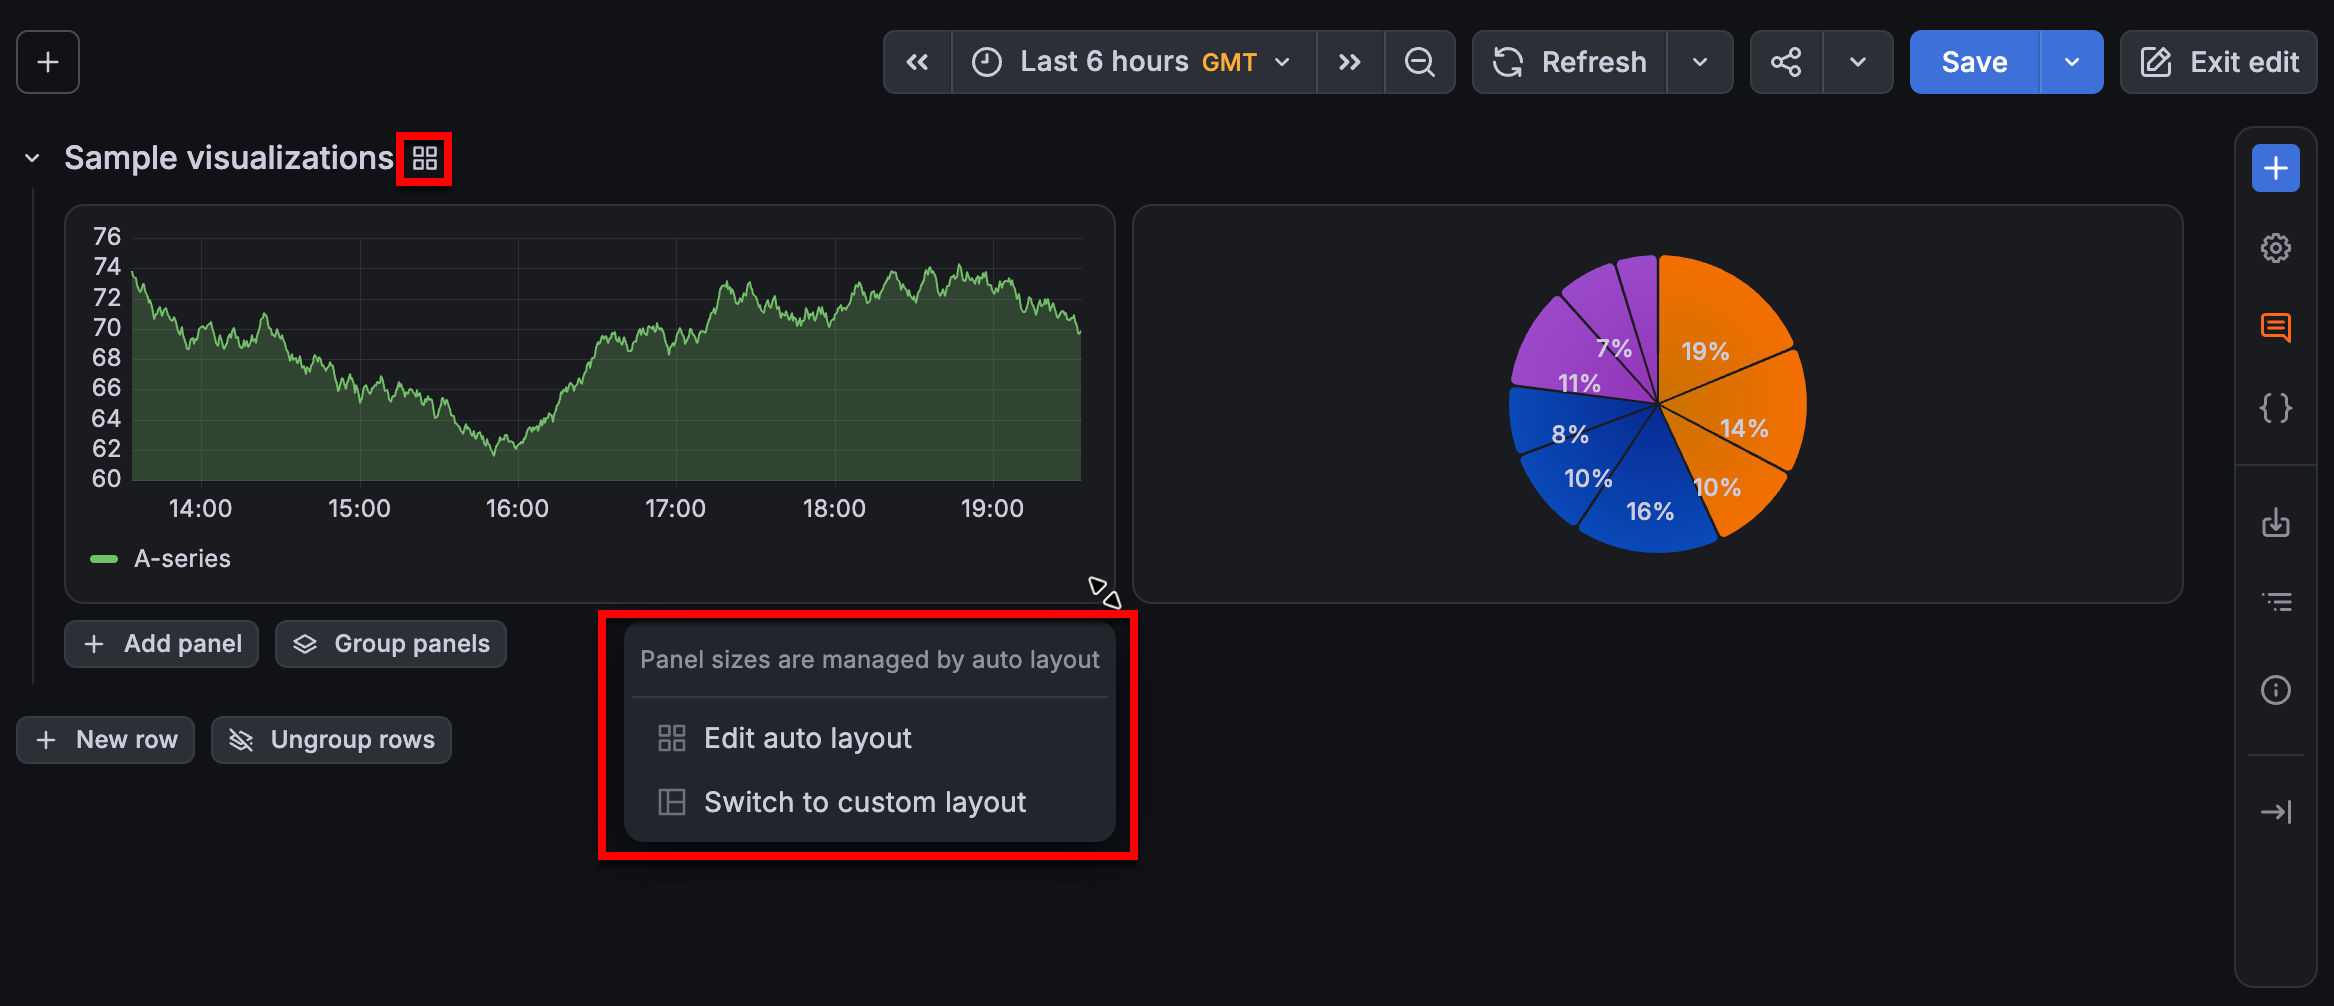
When you edit a dashboard that uses auto layout, Grafana manages panel sizes automatically. Until now, it wasn’t always clear why dragging the lower-right corner of a panel had no effect or how to change the layout.
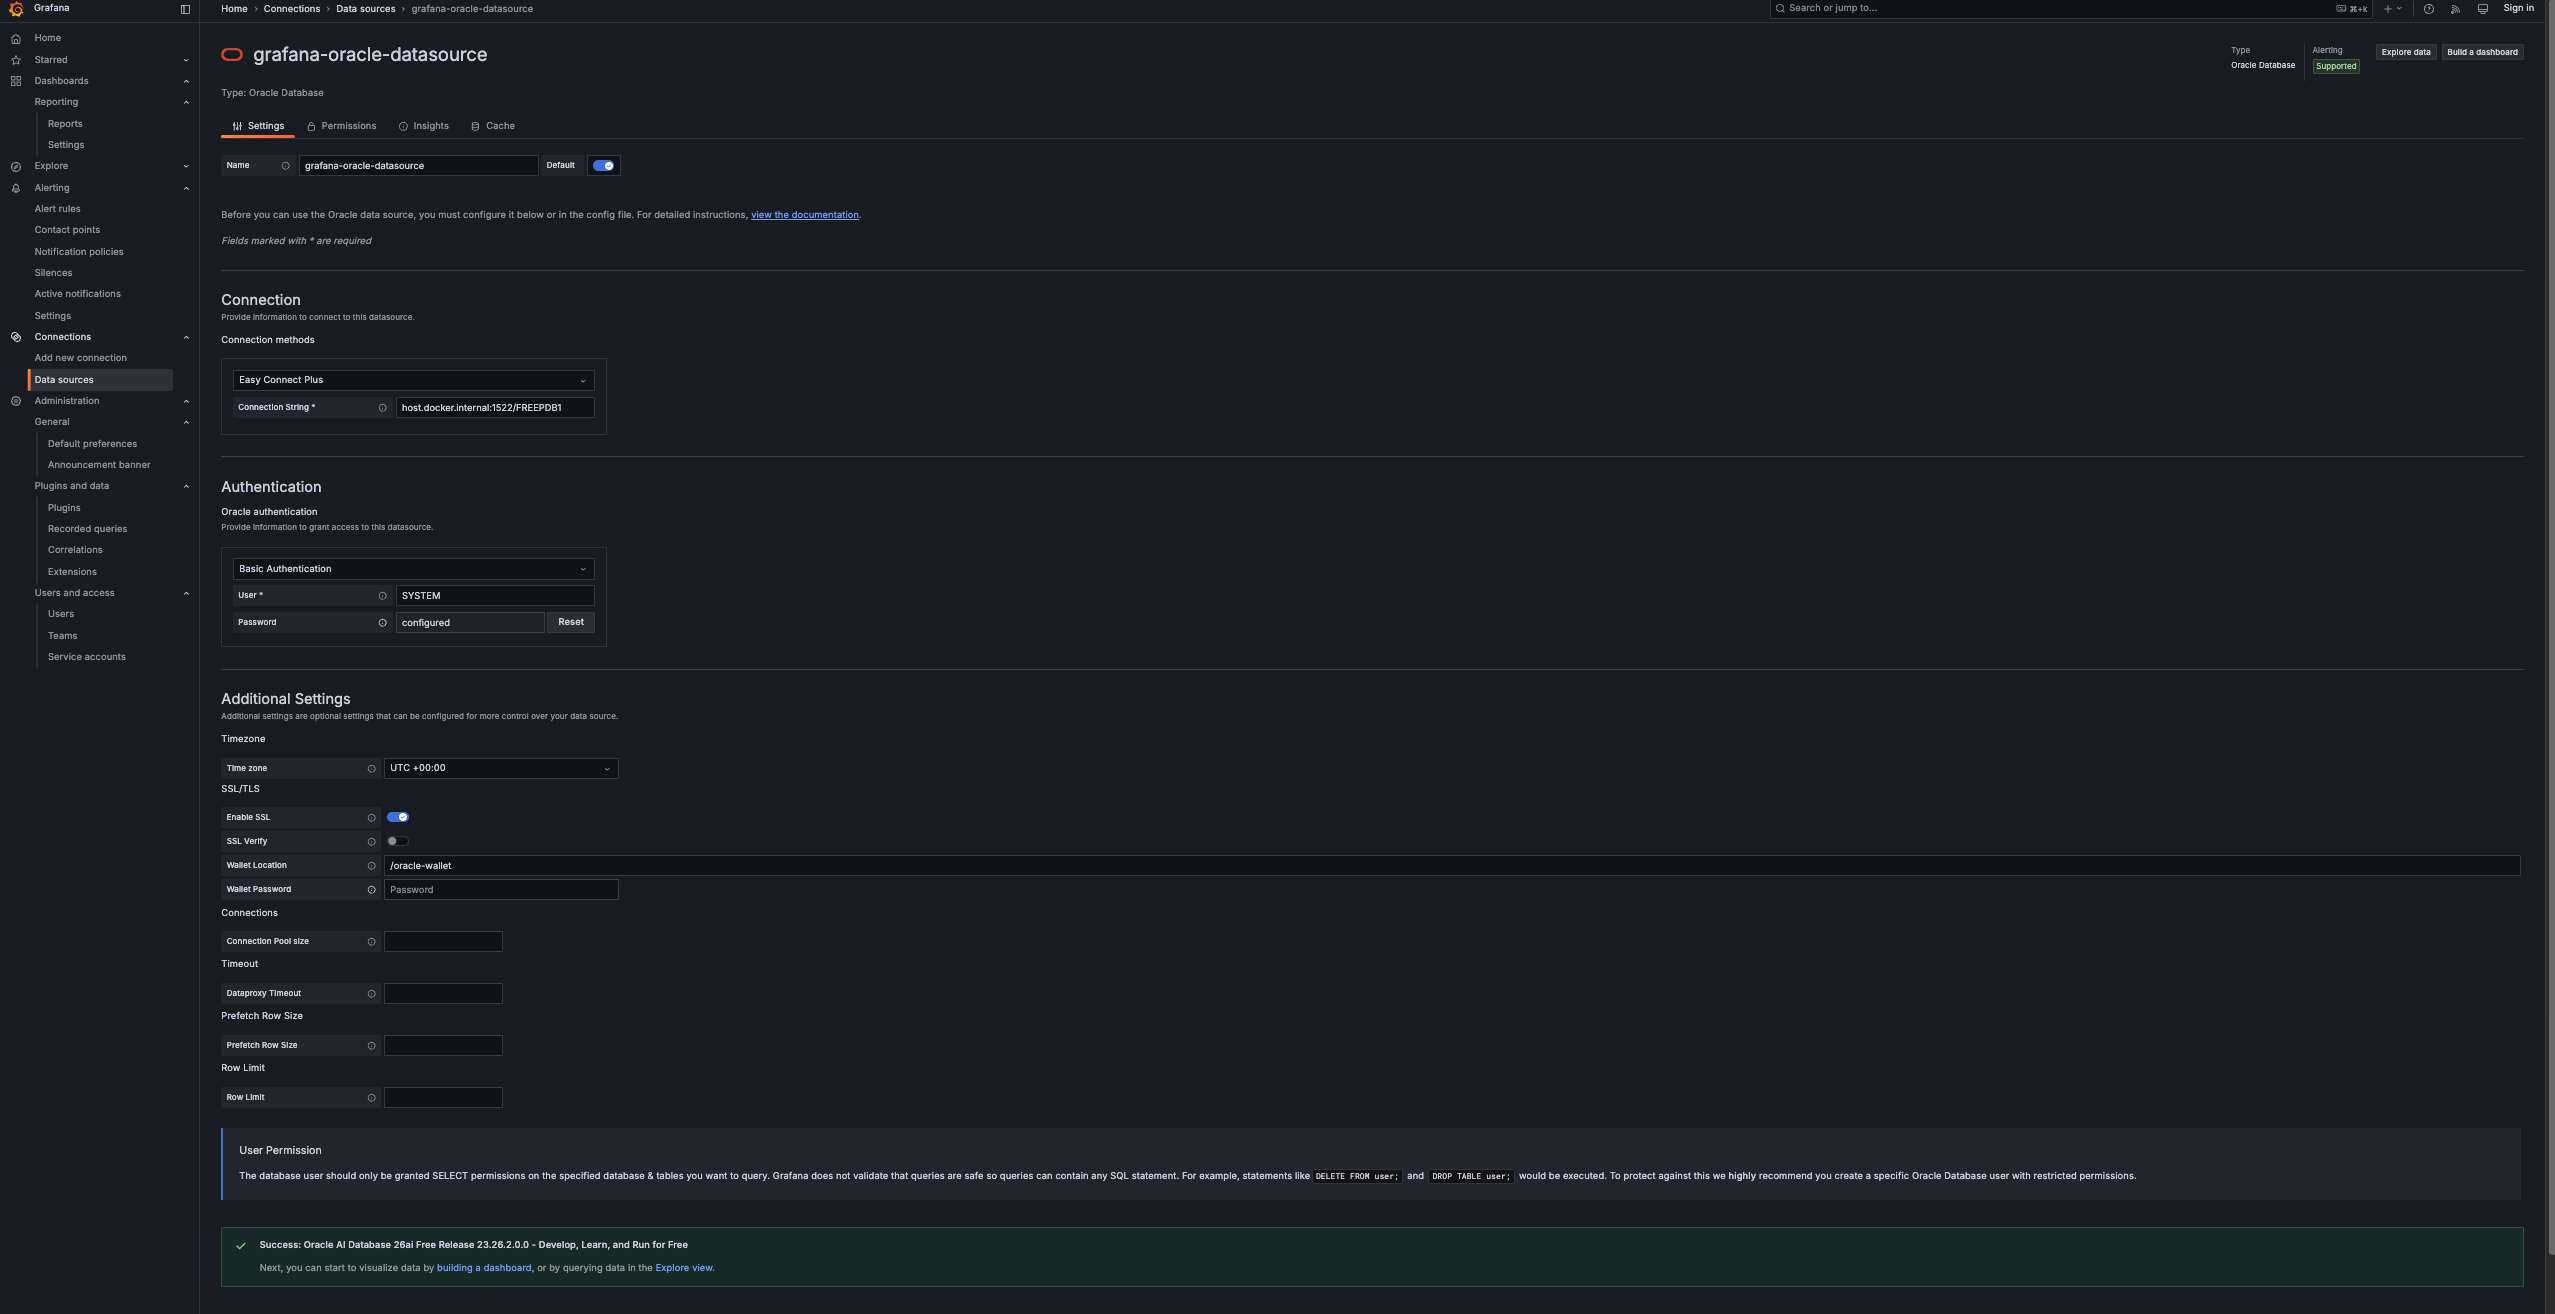
Connecting to Oracle just got easier with Easy Connect Plus.
Setting up an Oracle data source in Grafana no longer means wrangling a tnsnames.ora file or spelling out a full connection descriptor. The Oracle plugin now supports Easy Connect Plus, a third connection method that encodes the host, port, and service name in a single string. Just enter something like host:port/service and you’re connected. The port is optional and defaults to 1521, so myhost/orclpdb1 works too.
Guided configuration steps in Kubernetes Monitoring let you set up a Cluster by describing your environment instead of tuning Alloy yourself. That means there’s no need for:
The Grafana AI SDK is now open source. It’s a Go SDK for building your own agents, with support for Grafana Cloud, Anthropic, OpenAI, Amazon Bedrock, and any OpenAI-compatible endpoint.
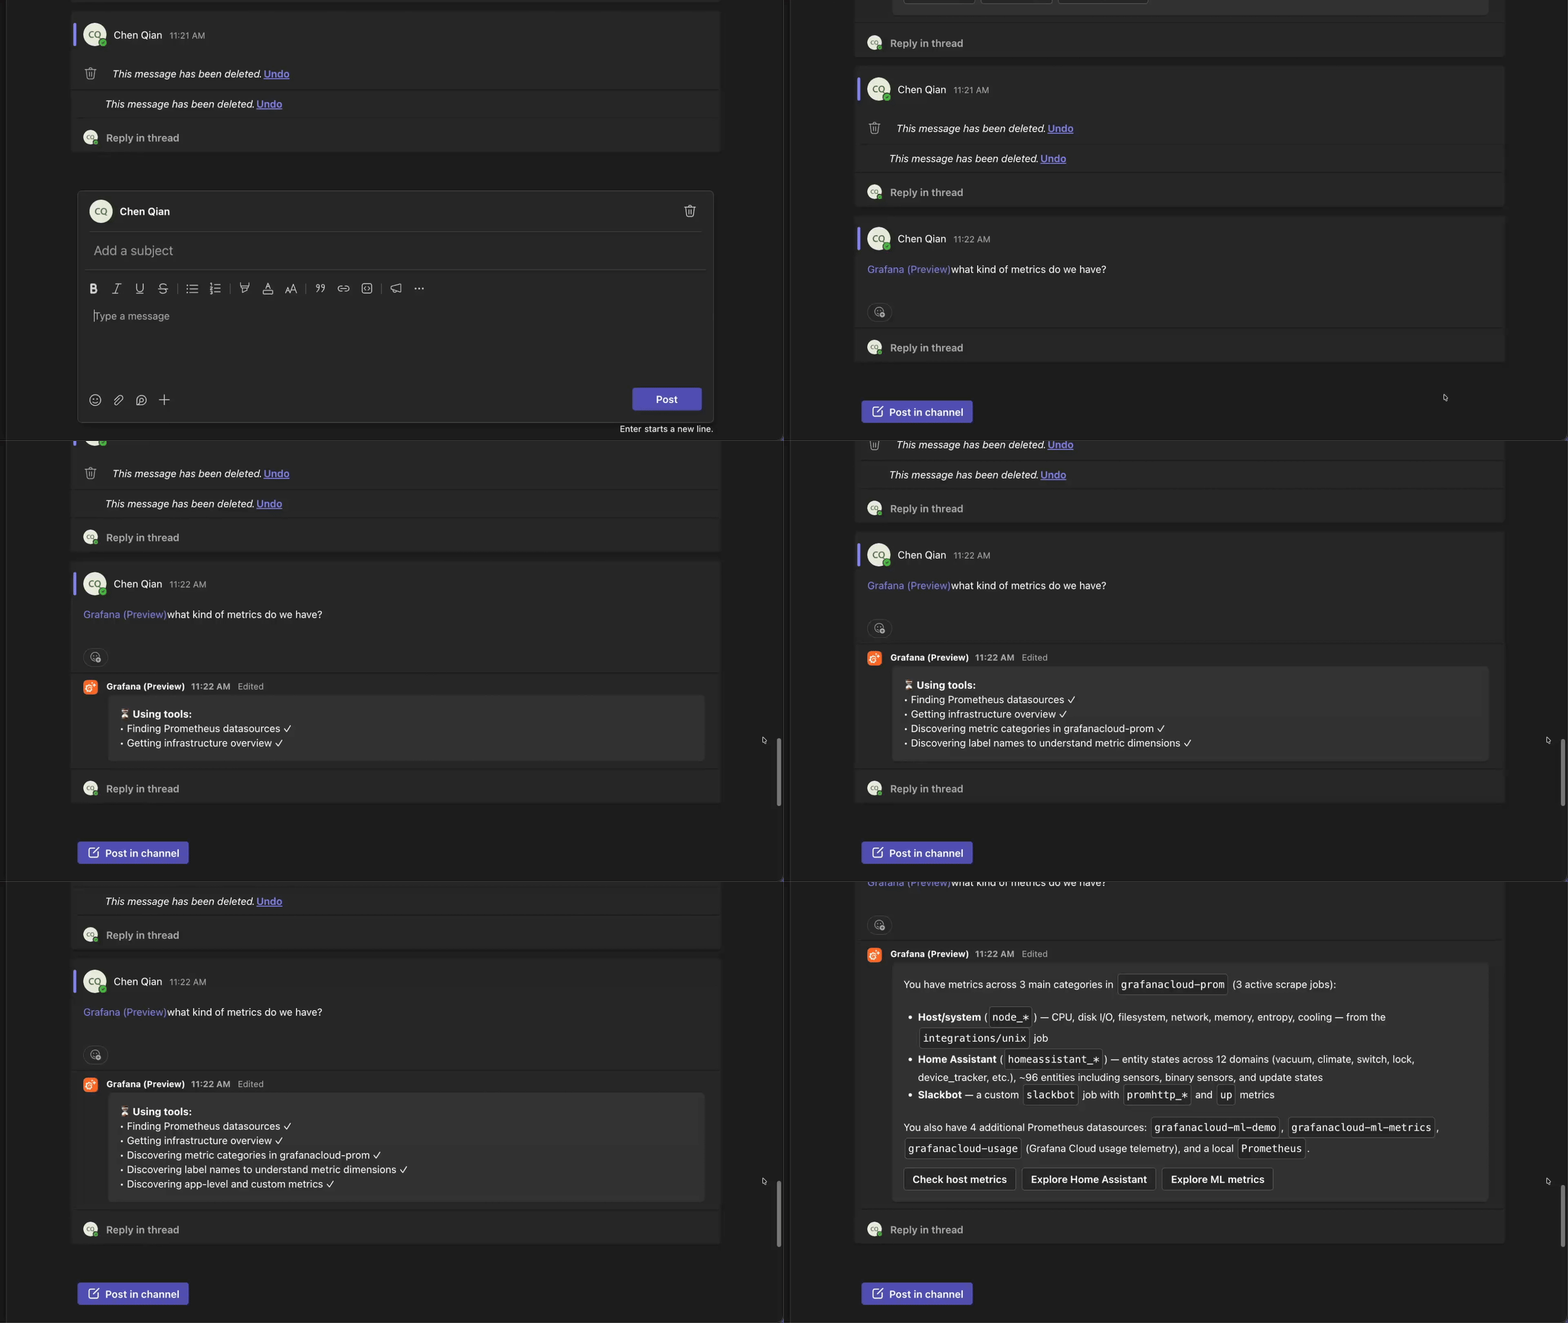
We’re excited to announce the Private Preview of Grafana Assistant in Microsoft Teams. The Assistant is already in Slack, and now it comes to Teams too, meeting your team where they already work. Once enabled for your organization, you can ask questions in your DMs and channels, get support on live issues, and pull in your Grafana Cloud data and integrations without leaving the conversation.
We’re excited to announce the private preview of the Grafana Assistant desktop app, which brings the Assistant closer to your workflow than ever. With the desktop app, the Assistant can work with your local file system, your code, and your other tools alongside all your data in Grafana Cloud, so you can wrangle alerts, incidents, dashboards, data sources, and more from one place.
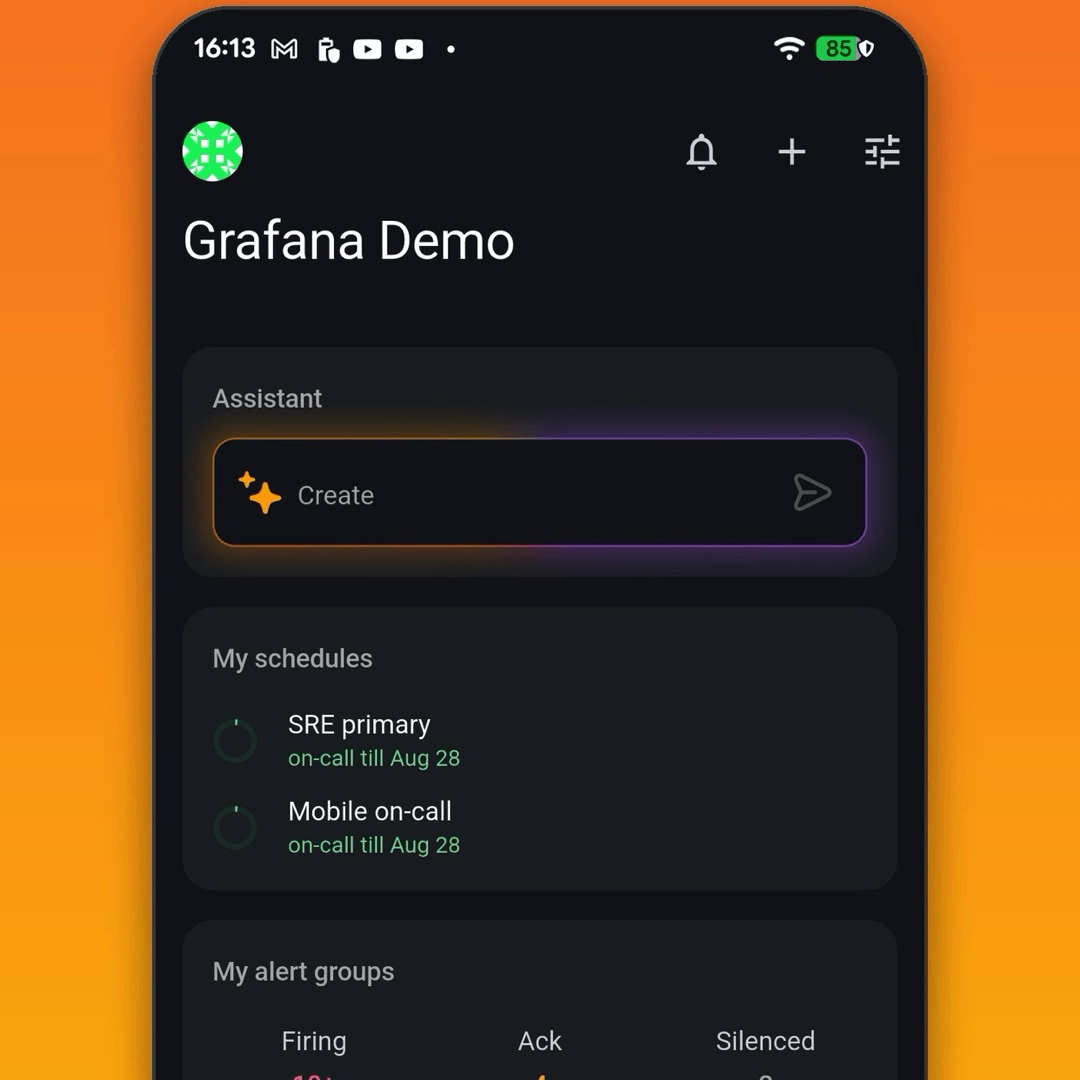
The Grafana IRM mobile app has a new name and a lot more to offer. It’s now the Grafana Mobile app, and it comes with Grafana Assistant built-in.
With the Assistant in your pocket, your phone becomes an actually useful extension of Grafana Cloud. Get paged by IRM, open an Assistant chat, and start remediation without waiting to get back to a keyboard. Because conversations sync across devices, you can start on your phone and pick up right where you left off on desktop, without losing any context.
What you can do:
- Respond: get alert group and incident context automatically pulled into the chat, so the Assistant can start investigating for you the moment you’re notified.
- Chat: ask the Assistant questions in plain language to understand what’s happening before you act.
- Verify: check on your dashboards and panels from anywhere.
Update to the latest Grafana app on iOS or Android to get started. Grafana Assistant and dashboard viewing are in public preview.
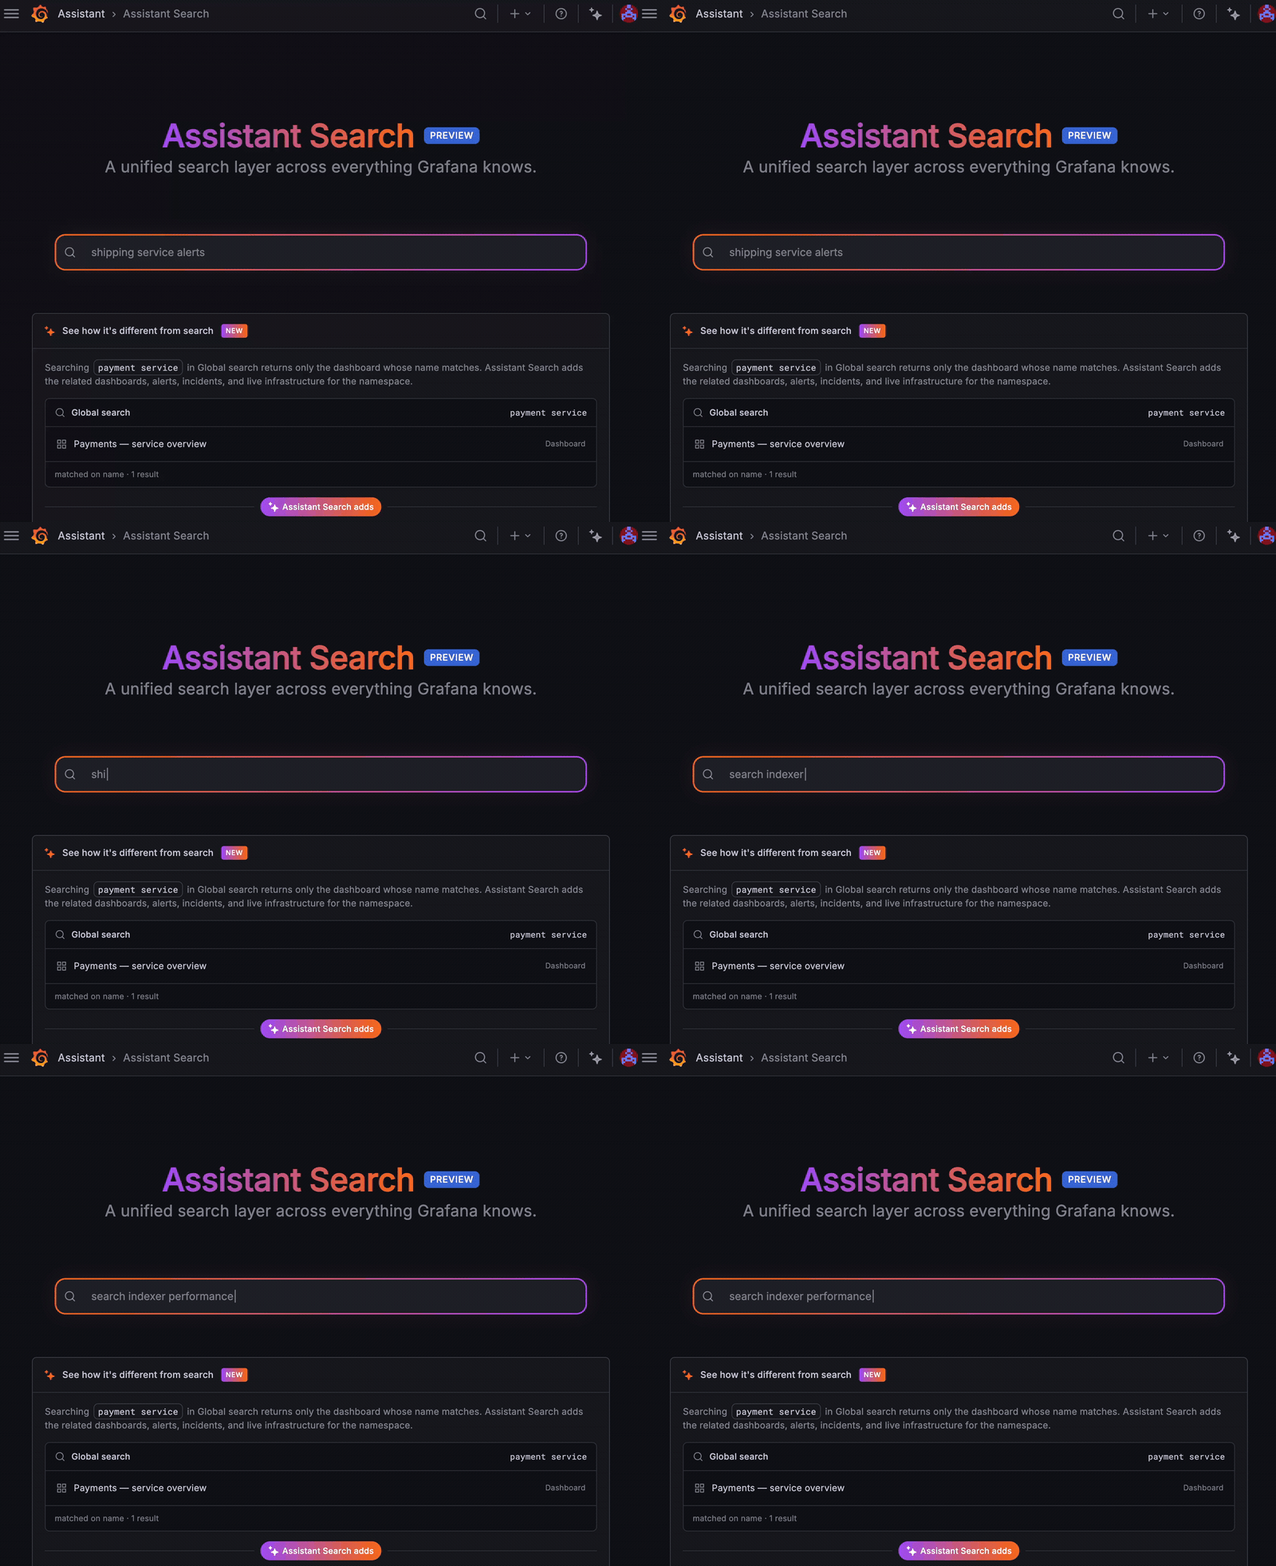
Stop hunting through menus for the dashboard you built months ago. Assistant Search lets you query your Grafana artifacts blazingly fast. Describe what you’re after in plain language, and get back the dashboards, alerts, incidents, Assistant Investigations, labels, and more that match, no exact names required.
Agent Observability is now generally available in Grafana Cloud. Agentic workloads need observability just like everything else you run, but it’s harder to see into how an agent reasons, what tools it calls, or where it quietly degrades. Agent Observability brings that behavior into the light, tightly integrated across Grafana Cloud and Grafana Assistant so it lives right next to the rest of your telemetry.