
What's new from Grafana Labs
Grafana Labs products, projects, and features can go through multiple release stages before becoming generally available. These stages in the release life cycle can present varying degrees of stability and support. For more information, refer to release life cycle for Grafana Labs.


Loading...
Area of interest:
Cloud availability:
Cloud editions:
Self-managed availability:
Self-managed editions:
No results found. Please adjust your filters or search criteria.
There was an error with your request.
We’ve redesigned dashboard filters for an improved filter creation experience!
The redesigned filters are more prominent in the dashboard and filters based on the same ad hoc filter variable are more clearly related. In the new design, you can click anywhere in the filter field to begin creating a one and Grafana automatically detects which part of the filter you’re setting up. It takes fewer clicks to create a filter and the creation process using keyboard strokes is smoother than previously.

We’re excited to announce the release of Grafana IRM Mobile, the next evolution of our mobile app which was previously known as Grafana OnCall. This rebrand marks a major step forward in providing teams with a seamless, comprehensive way to manage incidents—all from your mobile device.
Correlations is a feature that allows Grafana users to set up links between their data sources. Previously, the link generated would only be from one query to another—meaning results from a query could only generate links to open a second Explore pane with other query results.
We’re excited to announce that plugins can now leverage Grafana’s role based access control to define their own roles and permissions in order to control access to their routes.
A new escalation step is now available in Grafana OnCall. You can configure your escalation chains to automatically create an incident in Grafana Incident with a specified severity.
Explore Logs is a plugin that lets you automatically visualize and explore your logs without having to write queries. It makes finding spikes in your log volume, filtering your logs and pinpointing problematic log lines a lot easier and more smooth.
Introducing the Series limit in the Metrics browser.
On occasion, a Prometheus instance may contain a metric that has many, many series. When this happens the metrics browser can become slow or break when searching labels on a metric.

We’re excited to announce that k6 scripted checks in Synthetic Monitoring are now generally available.
k6 scripted checks were released in May 2024 as a public preview, to give you the power and flexibility to define your workflow tests in JavaScript, using the k6 API to efficiently author tests.

We’re excited to announce that k6 browser checks in Synthetic Monitoring are now in public preview.
With k6 browser checks, you can control a headless Chrome browser using a k6 script. Powered by the k6 browser module, browser checks collect frontend Web Vitals metrics, capture custom performance metrics, and simulate user actions like clicking buttons or filling forms. Any scripts you create are also portable between Synthetic Monitoring and Grafana Cloud k6, as they are backed by the same engine, allowing you to reuse your monitoring scripts for performance testing and vice versa.
The DynamoDB data source supports AWS Authentication via credentials file in ~/.aws/credentials. The plugin can be used with session toke along with credentials saved in AWS credentials file. To learn more, refer to DynamoDB documentation page as well as the following video demo.
Manage contact points, mute timings, and notification templates through Role-Based Access Control (RBAC). Choose who can create, edit, and read contact points, mute timings, and notification templates using permissions or fixed roles.
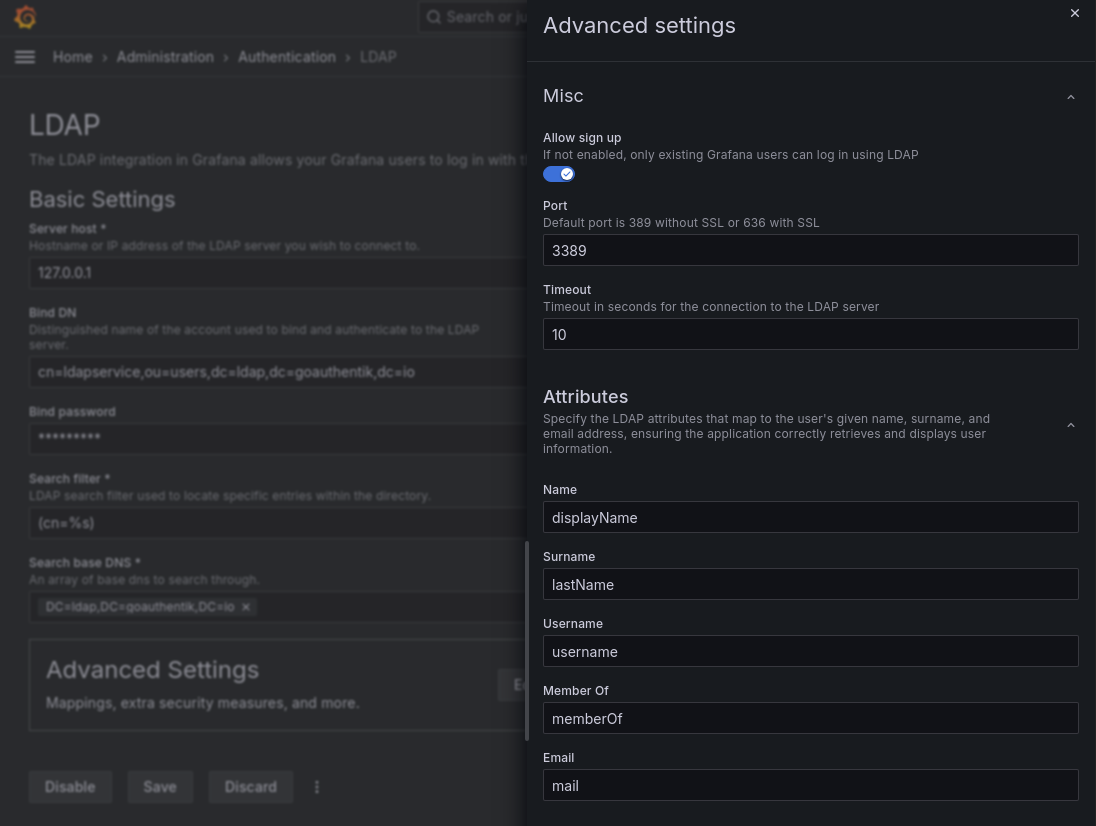
Set up your LDAP server as an Identity Provider from within the UI, or via API.
The new user interface makes it much clearer what each option does, and setting up the various configurations is now more transparent. Also, you no longer need to restart the Grafana instance for the new settings to take effect.
Grafana Cloud offers a fully managed experience for Grafana. However, for external plugins, customers must manage plugin version updates themselves. This creates extra maintenance overheard - and an unnecessary step in receiving important security patches, bug fixes or new features. This is why we are now introducing a new feature called Managed Plugins.

Create recording rules for Grafana-managed alert rules to calculate frequently needed expressions or computationally expensive expressions in advance and save the result as a new set of time series. Querying this new time series is faster, especially for dashboards since they query the same expression every time the dashboards refresh. Previously, this was only available for data-source managed alert rules.
You can now authenticate the GitHub data source using a GitHub App, providing an alternative to personal access tokens (PATs). GitHub App authentication offers enhanced security by granting more granular permissions, reducing the risk of over-permissioning.